Type
Oscillator
Short introduction
The price oscillator is not an independent indicator, but the difference between two indicators, usually two GDs.
Statement
By forming the difference, the indicator values fluctuate openly upwards and downwards around the zero line. A signal is generated by crossing the zero line.
In the calculation, the longer, "slower" GD is generally subtracted from the shorter, "faster" GD.
Formula/calculation
Price Oscillator =MAx -MAy
where:
MAx = Moving Average, shorter period
MAy = Moving Average, longer period
Interpretation
Since the indicator is usually formed on the basis of two GDs, we will also limit our interpretation to this case.
A value above the zero line indicates that the shorter GD is above the longer GD and that an upward trend is therefore prevailing in the base stock. Conversely, a value below the zero line indicates that the shorter GD is below the longer one and that a downward trend is therefore prevailing in the base stock. A signal is therefore given when the indicator crosses the zero line. A cut from bottom to top results in a buy, a cut from top to bottom results in a sell.
Another option is to create trend lines on the price oscillator itself and monitor them for breakthroughs. This means you receive the corresponding signals a little earlier.
Default setting
-
None, depends on the period analyzed, similar to pure GDs
Basic trading systems
-
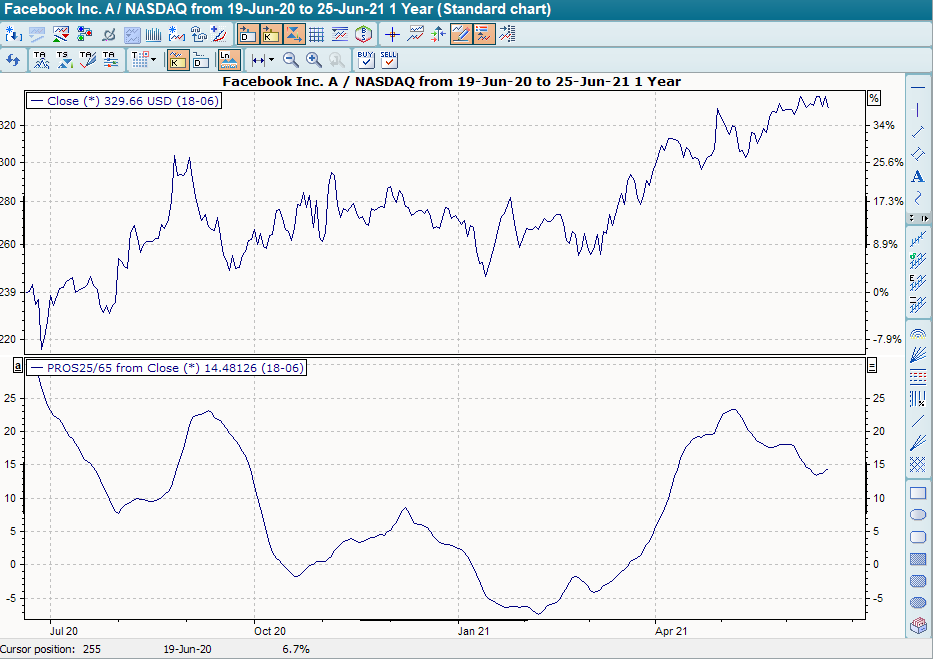
Price Oscillator
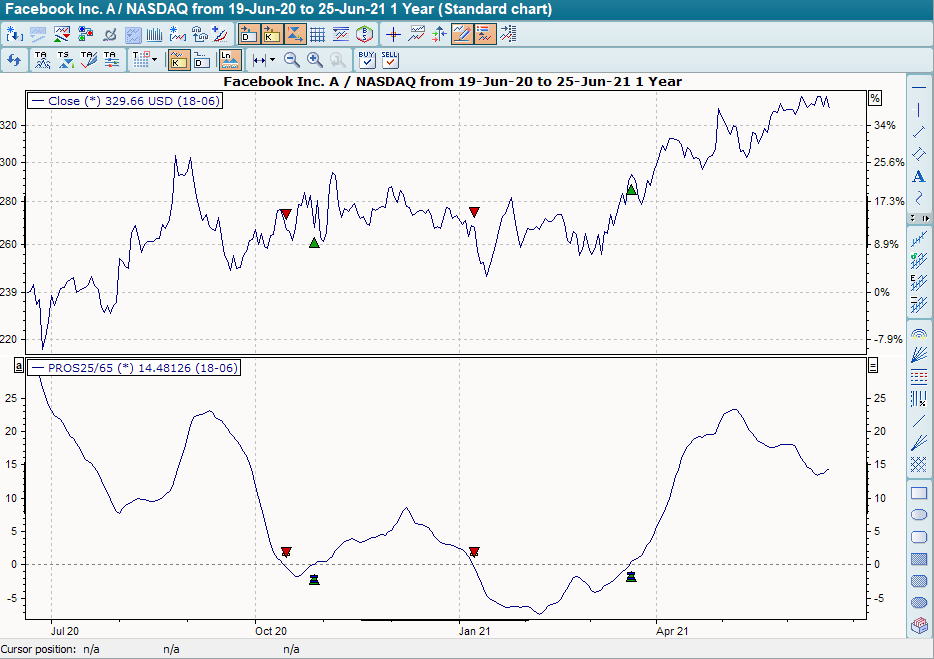
In the basic trading system, the default setting for the short (linear) GD is 25 and for the long (linear) GD 65. It provides buy signals when the indicator breaks through the zero line from bottom to top, and sell signals when it breaks through the zero line to the bottom.