Type
Trend follower
Short introduction
Welles Wilder developed the Parabolic SAR (PSAR) around a stop mark. In addition to the stop mark, the price trend and time are incorporated into the indicator.
Statement
The PSAR is constantly in the market, which means that a trading signal is triggered every time the PSAR intersects the price trend. Please note that the PSAR requires a certain "run-in time" and therefore the first signals should be ignored.
The calculation of the PSAR is complex. We therefore recommend that you study the literature listed.
Formula/calculation
SAR =SARn-1 + (AF * (EPlast -SARn-1))
where:
SAR = current SAR value
SARn-1 = previous day's SAR value
EP = extreme price of the last trend phase (high in uptrends, low in downtrends)
AF = acceleration factor
Interpretation
The PSAR always fluctuates around the actual price trend. When a trend develops, the PSAR moves closer and closer to the price trend, and an intersection of the PSAR with the price trend finally triggers the signal.
The PSAR works primarily in very strong trend markets, in trendless markets the PSAR delivers almost only false signals.
Default setting
-
daily, acceleration factor 0.02
Basic trading systems
-
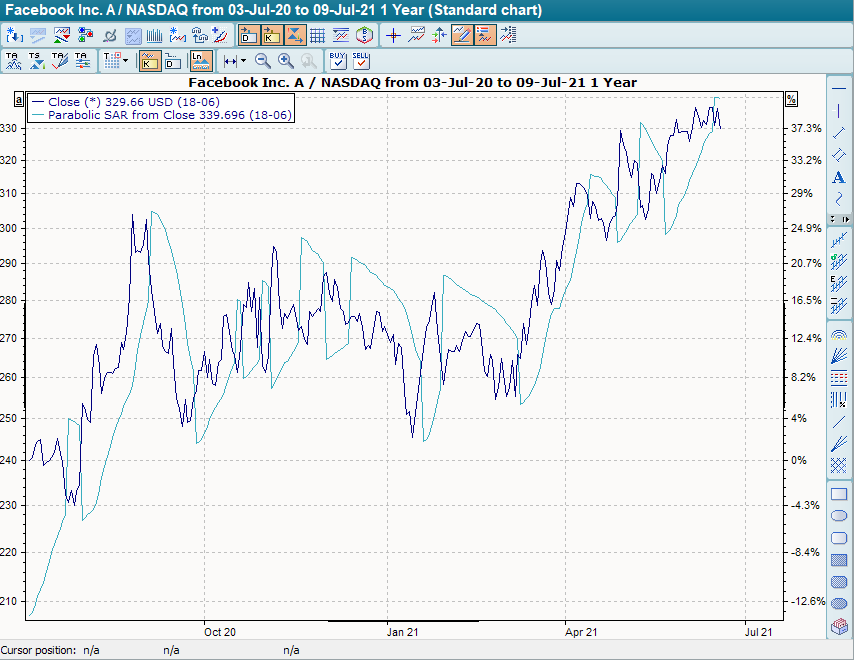
Parabolic SAR
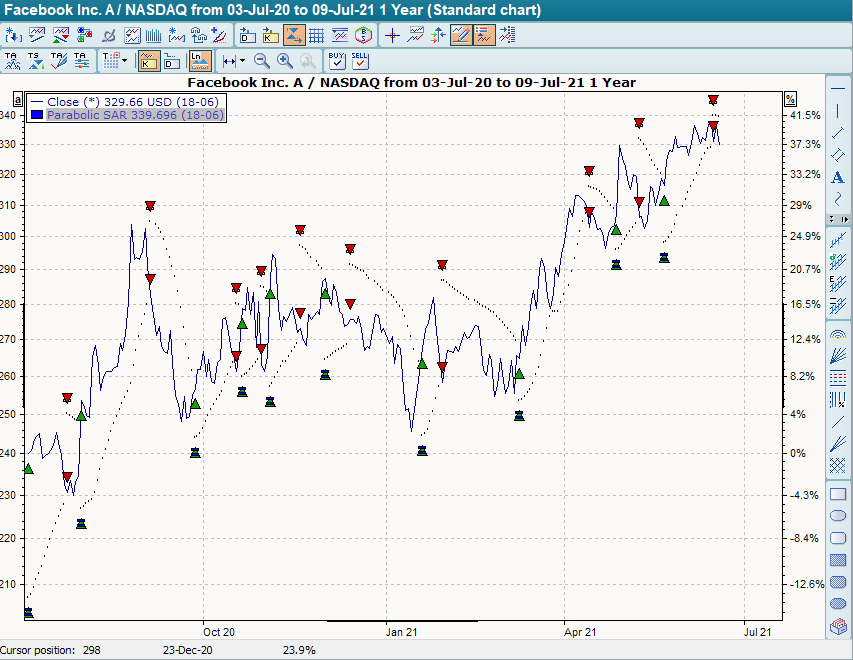
In the "Parabolic SAR" basis trading system, the indicator is shown as a dotted time series in the same chart as the underlying security. The default setting is 0.02 for the acceleration factor and 0.2 for the maximum factor. The base trading system provides buy signals when the indicator breaks through its base stock from top to bottom and sell signals when it breaks through its base stock to the top.