Type
Oscillator
Short introduction
The overbought/oversold indicator is one of the short-term trading indicators and is intended to show a short-term overvaluation or undervaluation of the market.
Statement
The overbought/oversold indicator (OBOS) is divided into three areas: A buying area, a selling area and an area that does not allow any statements to be made.
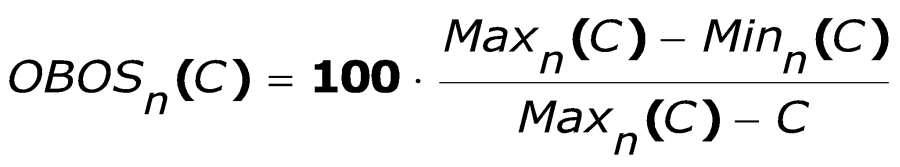
Formula/calculation
Interpretation
A security is usually considered oversold if the OBOS is below 30%. Conversely, it is overbought if a value of over 70% is calculated. It can be assumed that an oversold stock will soon return to a normal valuation, i.e. its price must rise, while an overbought stock does not promise any further price increases.
If the OBOS is in overbought territory, this means that the market lacks the capital to drive the price even higher. In the opposite case, it can be assumed that money will be reinvested in an oversold market, which would result in price increases.
Default setting
-
10 days
Basic trading systems
-
None