Type
Oscillator
Short introduction
Like Double Smoothed Stochastics , double stochastics is a variant of Stochastic indicator and goes back to Walter Bressert. The basic idea here was to apply the stochastic formula twice, i.e. to calculate the stochastic of a stochastic in order to limit false signals that occur due to oscillation at the edges of the extreme zones.
Formula/calculation
STO =EMAx((C -Minn(L)) / (Maxn(H) -Minn(L)))
DBS = 100 *EMAx((STO -Minn(STO)) / (Maxn(STO) -Minn(STO)))
where:
x = Period numbers of the smoothing
n = number of periods for the range
Statement/Interpretation
In addition to the chapter on Stochastic indicator , the following literature is recommended for the statement and interpretation of double stochastics:
-
Bressert, Walter: Profit Trader TM Manual, Walter Bressert Inc., 2003
-
Florek, Erich: New Trading Dimensions, FinanzBuch Verlag, 2000
-
Müller, Thomas and Lindner, Wolfgang: The big book of technical indicators, TM Börsenverlag
Default setting
-
n = 10
-
x = 3
Basic trading systems
-
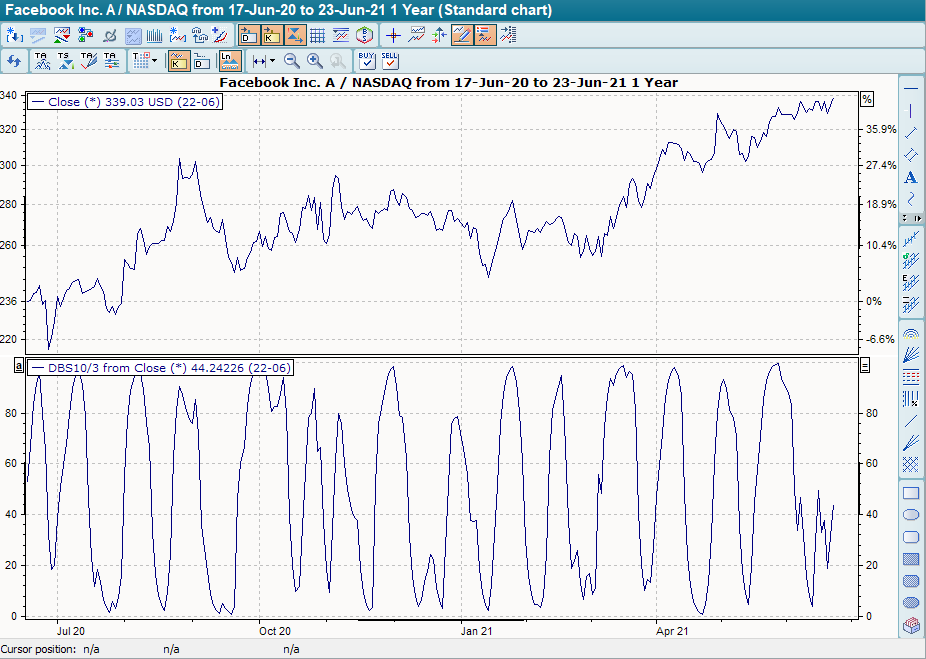
Double Stochastics
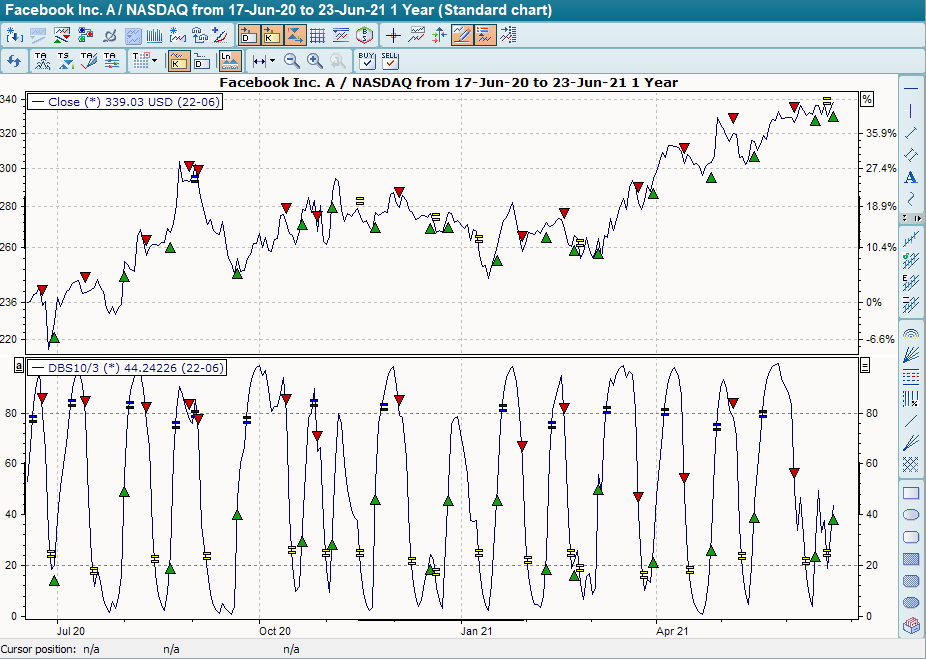
For the basic trading system "Double Stochastics", the indicator was used in its standard setting described above (period = 10, GD period = 3). The auxiliary lines at +20 and +80 are also shown. The base trading system provides buy signals when the indicator breaks through the line at +20 from bottom to top. These are closed out when it breaks through the line at +20 from top to bottom. It provides sell signals when the line at +80 is broken from top to bottom. Similarly, these sell signals are closed from bottom to top when the line at +80 is broken.