Type
Oscillator
Short introduction
The Stochastic indicator is the subject of various improvement efforts. Double Smoothed Stochastics was developed by William Blau and published in 1991. It is derived from the stochastic indicator (in the most commonly used slow variant) by replacing linear smoothing with double exponential smoothing.
Formula/calculation
DSS = 100*EMAy(EMAx(C -Ln)) /EMAy(EMAx(Hn -Ln))
Slow variant:
DSSslow =EMAz (DSS)
where:
n = number of periods for the range
x,y = period numbers of the double smoothing
z = number of periods of slow smoothing
Statement/Interpretation
In addition to the chapter on Stochastic indicator , the following literature is recommended for the statement and interpretation of double smoothed stochastics:
-
Blue, William: Double Smoothed-Stochastics, Technical Analysis of Stocks & Commodities, 1/1991
-
Kaufman, Perry J.: Trading Systems and Methods, Wiley, 1998
-
Florek, Erich: New Trading Dimensions, FinanzBuch Verlag, 2000
-
Müller, Thomas and Lindner, Wolfgang: The big book of technical indicators, TM Börsenverlag
Default setting
-
n = 5
-
x = 7
-
y = 3
-
z = 3
Basic trading systems
-
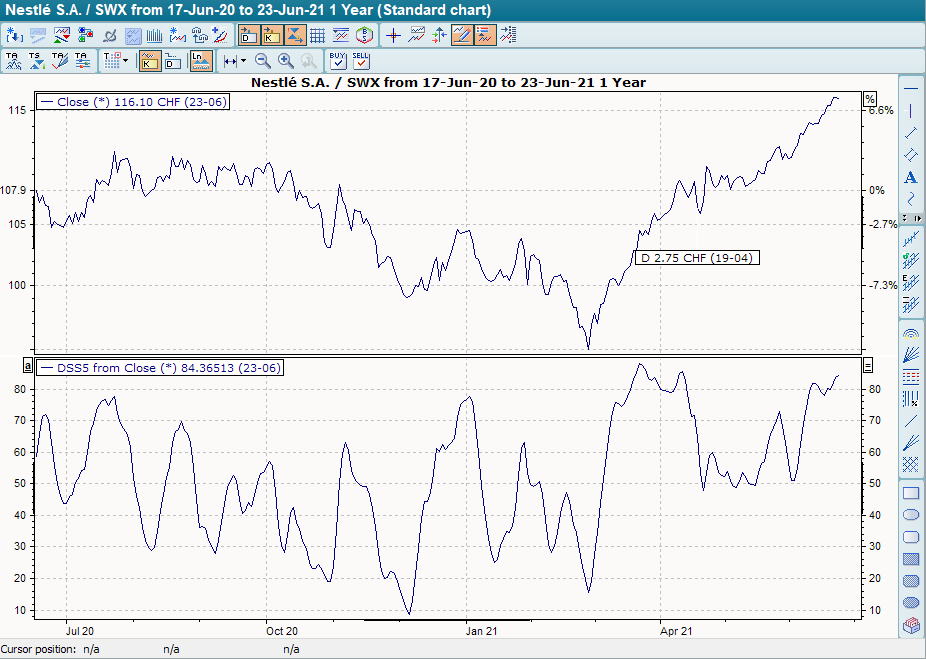
Double Smoothed Stochastics
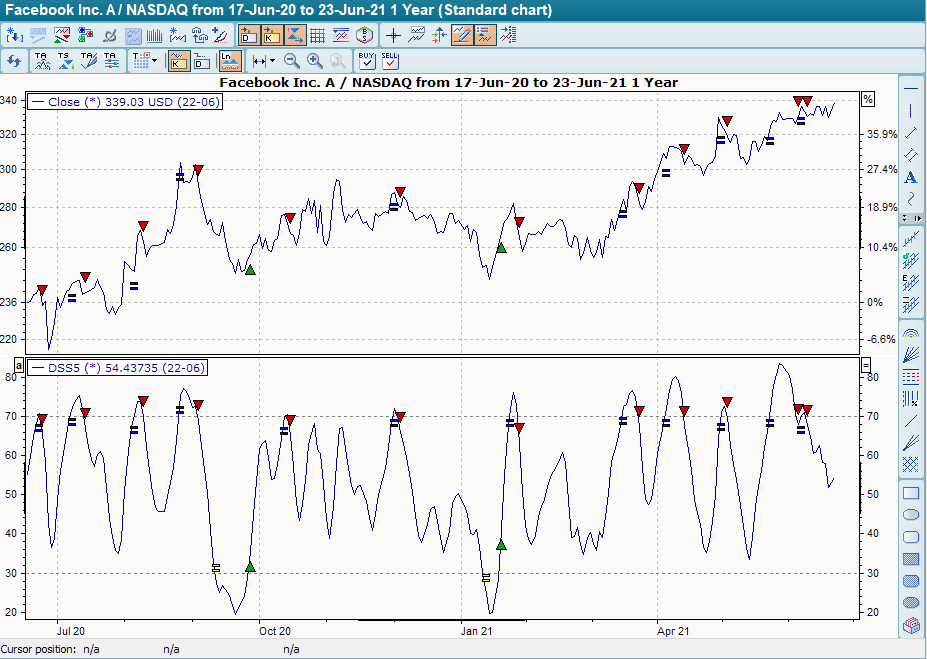
For the basic trading system "Double Smoothed Stochastics", the indicator was used in its standard setting described above (K period = 5, GD period1 = 7, GD period2 = 3 and GD periodSlow = 3). The auxiliary lines at +30 and +70 are also shown. The base trading system provides buy signals when the indicator breaks through the line at +30 from bottom to top. These are closed out when it breaks through the line at +30 from top to bottom. It provides sell signals when the line at +70 is broken from top to bottom. Similarly, these sell signals are closed out when the line at +70 is broken from bottom to top.