A diagram consists of one or more data series. You can display these series graphically in different ways, depending on the data type. You can see which series have already been created in the "Series" field in the "Diagram definition" dialog box.
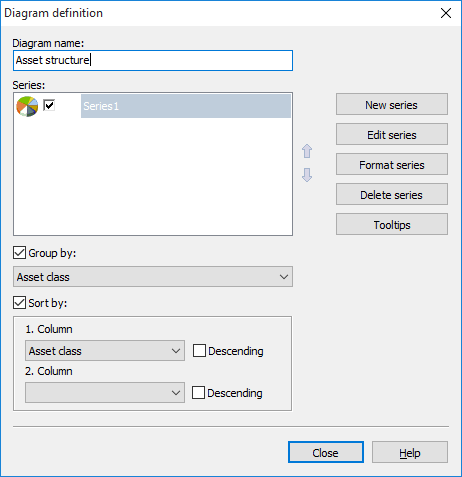
If you have created a chart with several series, you can use the "Series" field to specify whether a data series should be displayed in the foreground or background of the chart. The lowest list position corresponds to the foreground, the top list position to the background. You can change the position of a selected row using the two arrows to the right of it.