The individual data series are displayed on a drawing area for which you can make numerous settings (edit background, show or hide axes, etc.).
![]()
Switch to the "Chart" tab. Here you will find numerous other tabs where you can make the desired settings.
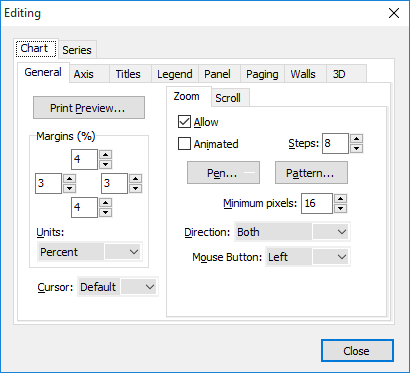
This dialog window is very extensive and offers you almost unlimited setting options.
All changes made here are immediately applied to the diagram. Make the desired settings and close the dialog window with the "Close" button.