Type
Trend follower, oscillator (variant "Aroon-Oscillator")
Short introduction
The Aroon indicator was designed by Tushar Chande in the first half of the 1990s. The presentation of the indicator reverses the usual roles of price and time. While indicators generally show price changes over time, the Aroon represents the duration of time since the occurrence of certain events.
Based on the idea that uptrends regularly produce new highs and downtrends new lows, Chande measures the time that has elapsed since the last high or low point occurred and compares them. In this way, the course of a trend is illuminated and trend phases can be distinguished from sideways phases.
Formula/calculation
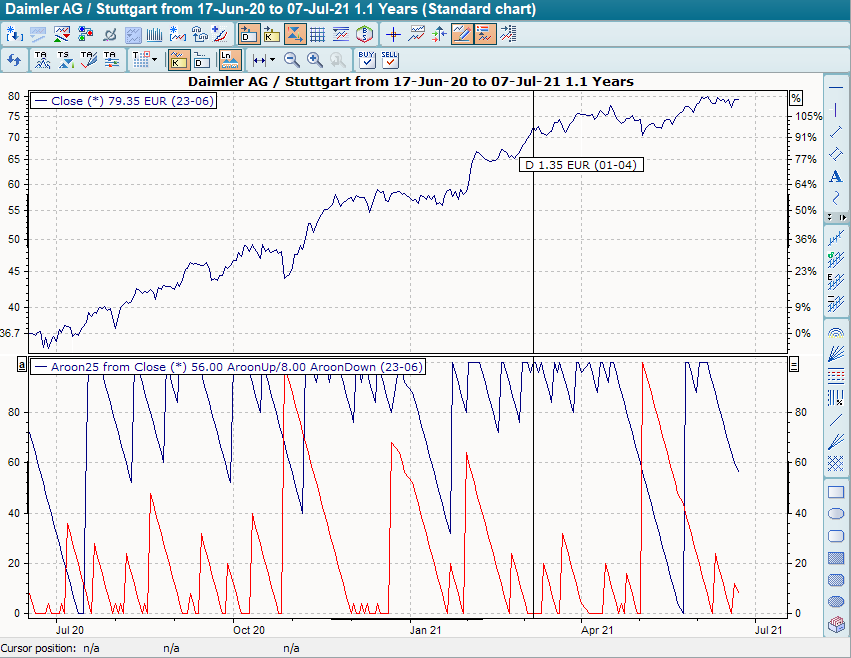
The Aroon is displayed in the form of the two curves Aroon Up and Aroon Down or as an oscillator. First, the time of the current n-period peak is determined. The Aroon-Up is then calculated as the percentage position of this point in time within the n-period interval. The same applies to the aroon down in relation to the n-period low point. The Aroon curves therefore evaluate extreme points, whereby this evaluation decreases with increasing age of the extreme points. In short: the younger, the higher the grades.
The Aroon oscillator, on the other hand, is the difference between Aroon up and Aroon down.
Aroon
PSHt = Max{ i: 0..n-1 |Ht-i =Maxn(H)t }
PSLt = Max{ i: 0..n-1 |Lt-i =Minn(L)t }
Aroon-Up= 100 * (1 - PSH/n)
Aroon-down= 100 * (1 - PSL/n)
Aroon-oscillator
Aroon-Osc= Aroon-Up - Aroon-down
where:
PSH = number of periods since the occurrence of the last n-period peak
PSL = number of periods since the occurrence of the last n-period low point
n = number of periods considered
Statement/Interpretation
The following literature is recommended for the statement and interpretation of the Aroon:
-
Chande, Tushar: A Time Price Indicator, Technical Analysis of Stocks & Commodities, 1995
-
Chande, Tushar and Kroll, Stanley: The New Technical Trader, Wiley & Sons, 1994
-
Müller, Thomas and Lindner, Wolfgang: The big book of technical indicators, TM Börsenverlag
-
Florek, Erich: New Trading Dimensions, FinanzBuch Verlag, 2000
-
Colby, Robert W.: The Encyclopedia of Technical Market Indicators, 2nd Edition, McGraw-Hill, 2003
Default setting
-
n = 25
Basic trading systems
-
Aroon Oscillator
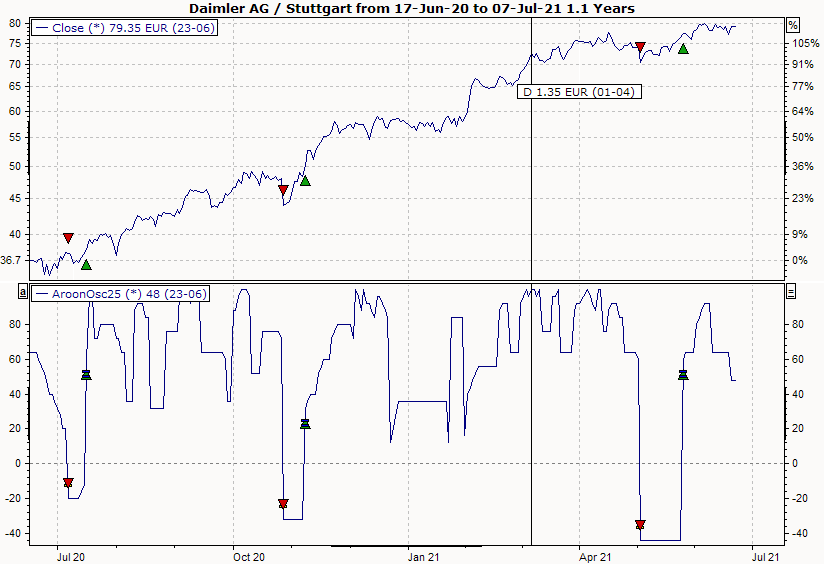
The oscillator variant was created for you as a basic trading system for the Aroon. In its standard setting with a time period of 25, the "Aroon Oscillator" base trading system provides buy signals when the indicator crosses the zero line drawn from bottom to top and sell signals when it crosses the zero line from top to bottom.