Type
Trend follower
Short introduction
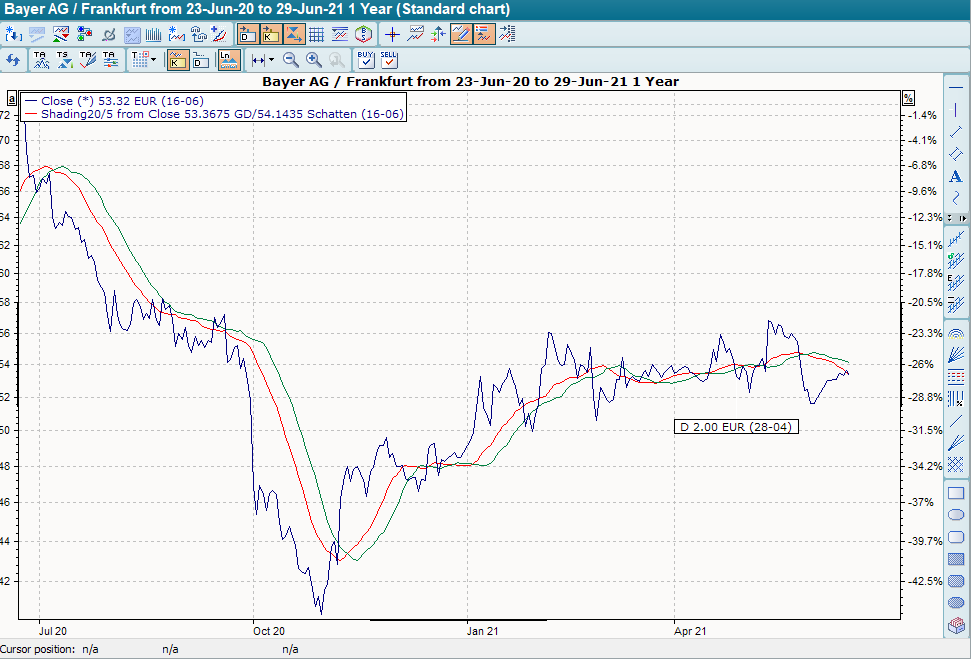
The shadow lines developed by Larry Williams are based on a modified concept of moving averages.
Statement
Williams first calculates a GD. Then he also draws this GD in the chart shifted to the right. This shifted "GD" practically represents a "shadow line" of the original one. Buy and sell signals are generated at the intersections of these two lines.
Formula/calculation
Williams shadow line = MA + VF
where:
VF = displacement factor
Interpretation
The direction of the GD indicates the prevailing trend in the underlying security; the intersections are intended to generate trading signals when the trend in the underlying security changes. If the GD crosses its shadow line from bottom to top, a buy signal is generated. If the GD cuts its shadow from top to bottom, this is considered a sell signal.
Default setting
-
MA and displacement factor any
Basic trading systems
-
Williams shadow lines
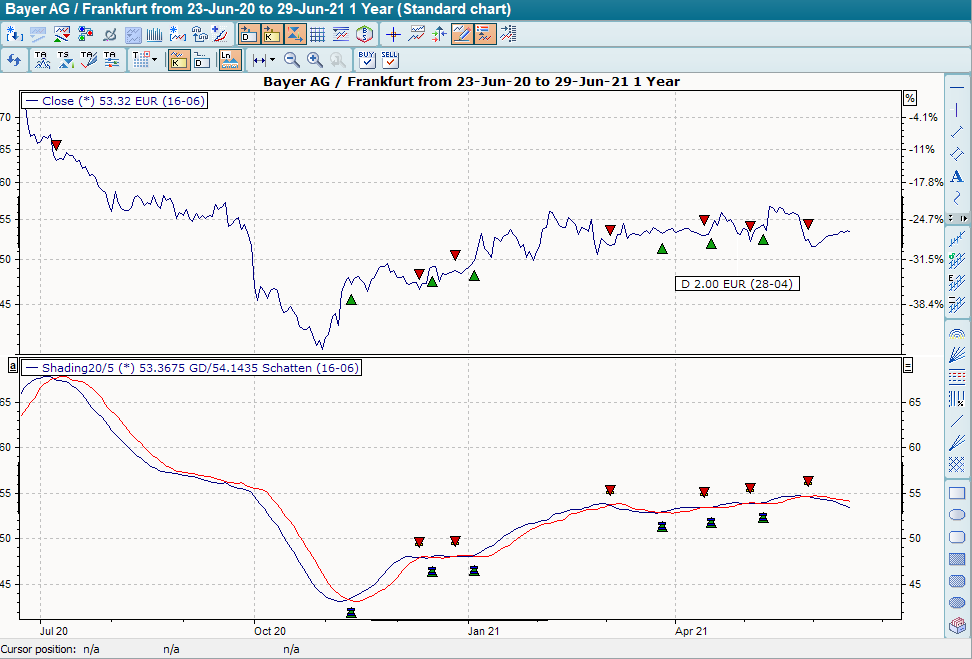
The basic trading system "Williams shadow lines" is created with the following settings: Period 20 days for the linear GD, shadow at 5. It provides buy signals when the GD breaks through its shadow line from bottom to top, and sell signals when the GD crosses its shadow from top to bottom.