If you have entered limits for a security, you can also show these in the chart.
-
Open a chart via the search field and object search.
-

Or select the VIEW, SECURITY LIMITS command in the context menu of the selected time series.
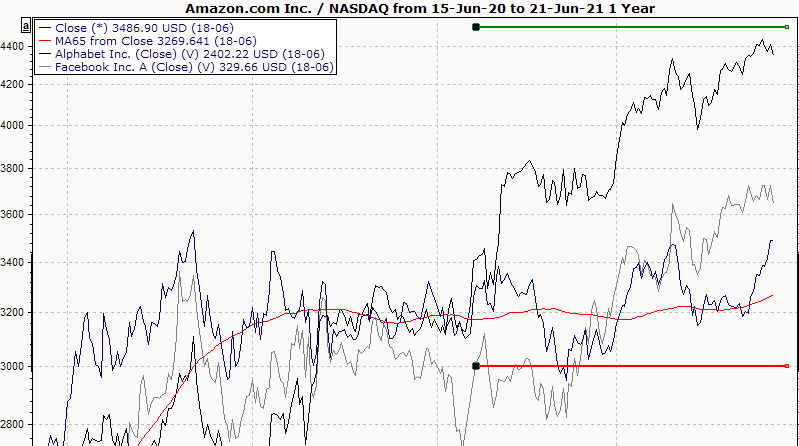
Previously defined limits for this security are represented by colored lines in the chart.
|
Green |
Limit target |
Blue |
Limit loss |
Red |
Limit stop |
-
If you hover over the lines with the mouse, the information on this limit is displayed in a yellow information window.
-
To edit the limit directly from the display, select the LIMIT, EDIT command in the context menu of a line.
Read the chapter on signals and limit monitoring, in particular Limit display in the chart.