-
To show security limits in the chart, right-click on the time series in the chart window to open the context menu.
-
Select the VIEW, PAPER LIMITS command in the context menu.
![]()
|
Color |
Description |
|---|---|
|
Green |
Limit target |
|
Blue |
Limit loss |
|
Red |
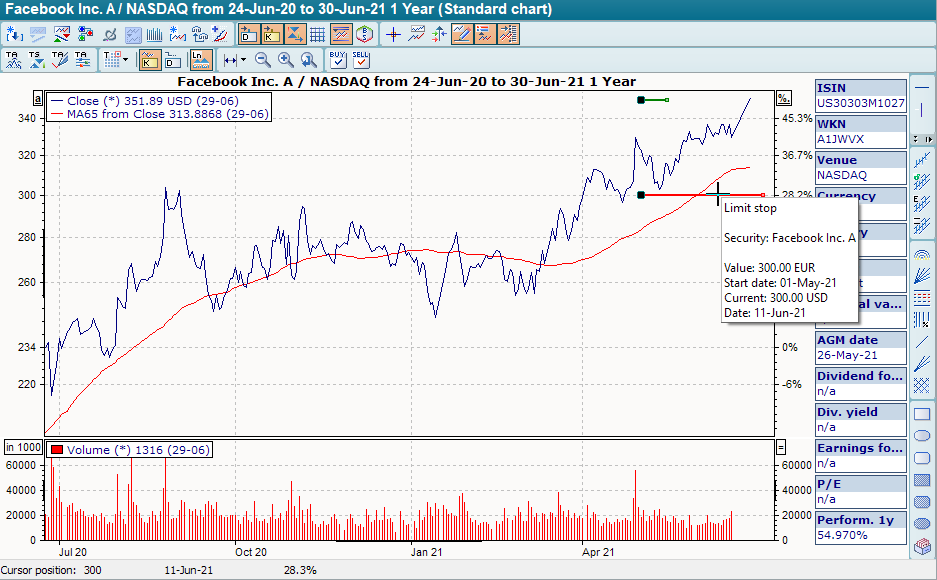
Limit stop |
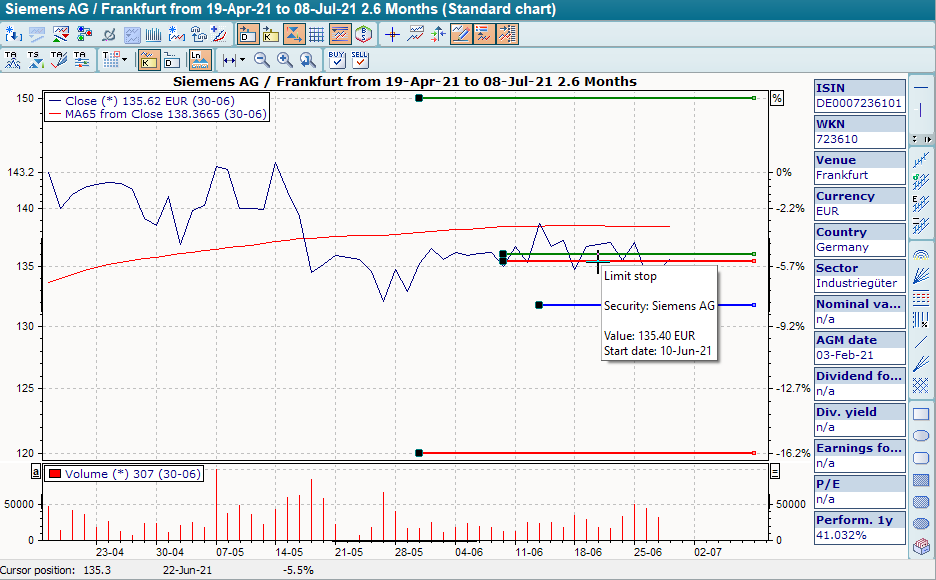
-
If you hover over the lines with the mouse, the details of this limit are displayed in a yellow information window.
-
For target limits, the line is limited to the end date (start date + validity) if a validity period has been entered.
-
To edit the limit directly from the chart display, right-click on a line and select the command EDIT LIMIT... from the context menu
-
Progressive limits (stop and loss) are displayed as a "sloping" line (non-cumulative) or as a curved line (cumulative, a straight line in logarithmic view).
-
With short limits, the breakout directions are reversed compared to the "normal" limits.
-
Progressive short limits have a negative slope while "normal" limits have a positive slope.
-
In charts whose currency differs from the limit currency, the limits are displayed as curves calculated using exchange rates.