Type
Oscillator
Short introduction
The Volume Price Trend (VPT) is a simple combination of momentum and turnover. This indicator was developed by Steve L. Kille.
Statement
The indicator is calculated by multiplying the respective price changes by the turnover of the day in question. The respective result is added up over the desired period.
The result fluctuates openly above and below the zero line, as the values are positive on days with price gains and negative on days with price falls. The amount of the individual value depends on the turnover and the actual price movement.
Formula/calculation
VPT = ((Ct-Ct-1)*Vt)+((Ct-1-Ct-2)*Vt-1)+...((Ct-n+2-Ct-n+1)*Vt-n+1)
Interpretation
The interpretation is generally done in two different ways, firstly via trend changes in the indicator and secondly via the calculation of a GD on the VPT.
If the indicator turns downwards in positive territory, this shows that the upward momentum is weakening and a fall in the price trend is likely. An upward turn in negative territory indicates a weakening downward trend and thus rising prices in the near future.
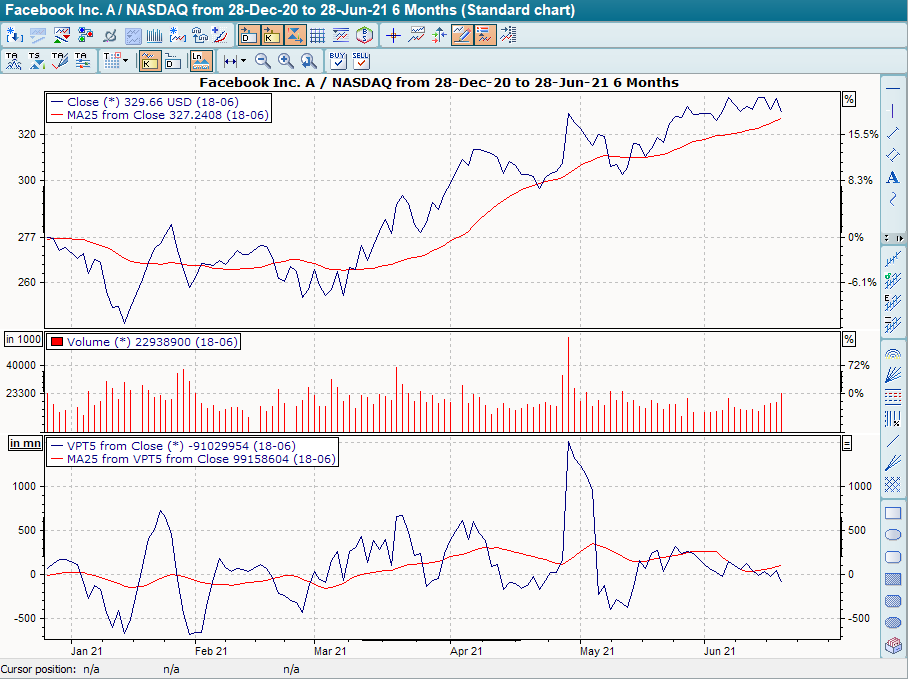
The other option is to calculate a GD on the VPT and use the intersection of the two lines as a signal generator. A buy signal is given when the VPT crosses its GD from bottom to top, a sell signal is given when the VPT crosses its GD from top to bottom.
Default setting
-
5 days for the VPT
-
10 days for the GD signal transmitter
Basic trading systems
-
Volume Price Trend (VPT)
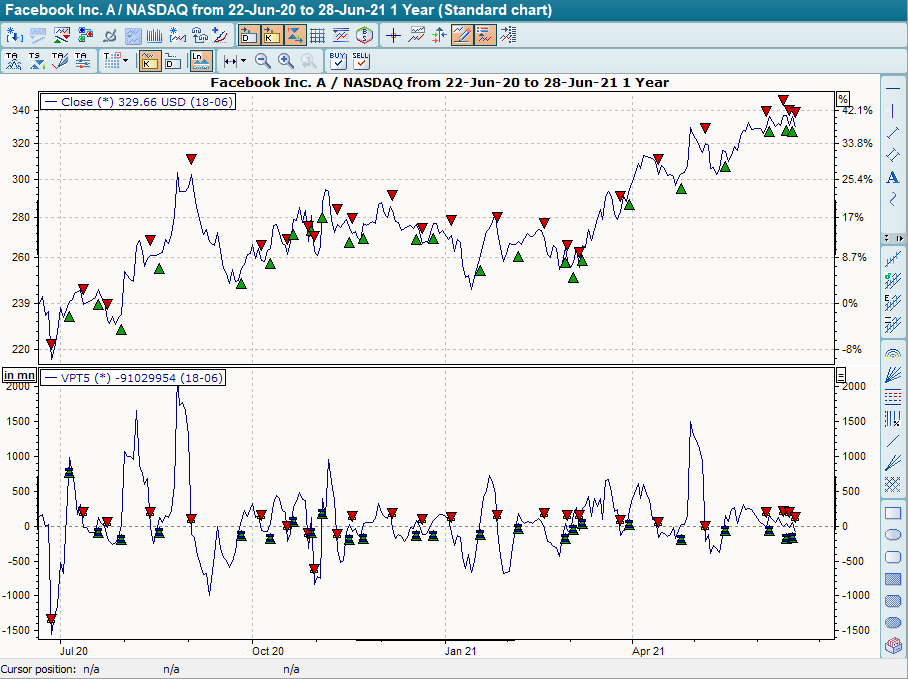
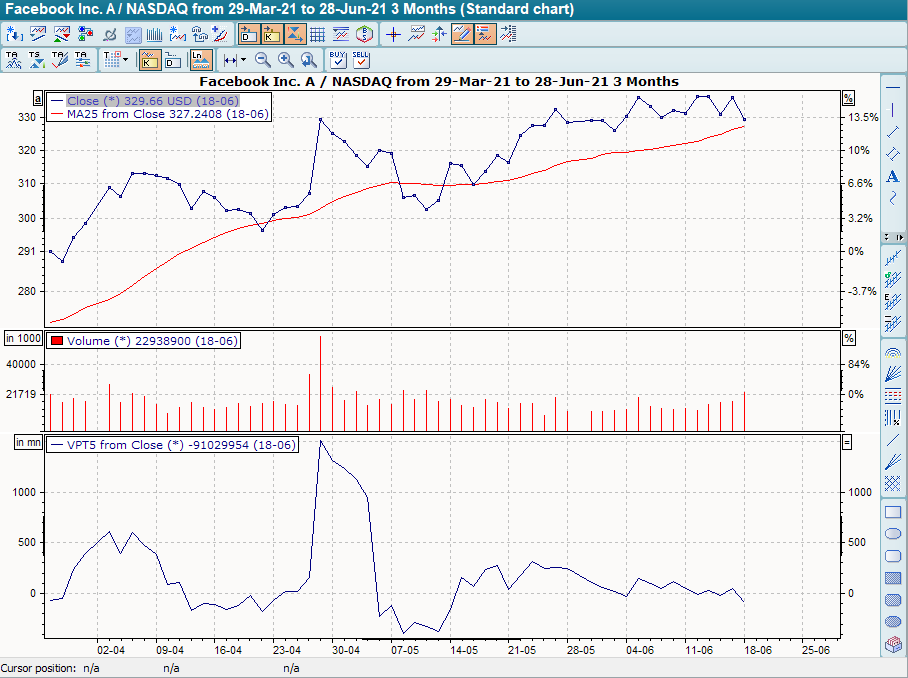
The base trading system "Volume Price Trend (VPT)" fluctuates around a center line at 0, the period for the VPT is 5. It provides buy signals when the indicator breaks through the zero line from bottom to top, and sell signals when the indicator breaks through it from top to bottom. In the screen example, the signals for smoothing have been hidden for a better overview using the command SIGNALS PHASE.