Type
Oscillator
Short introduction
Similar to the Volume Price Trend (VPT), the Force Index is also a combination of momentum and turnover. The indicator was developed by Dr. Alexander Elder, who wanted to use the indicator to measure the strength of bulls and bears.
Statement
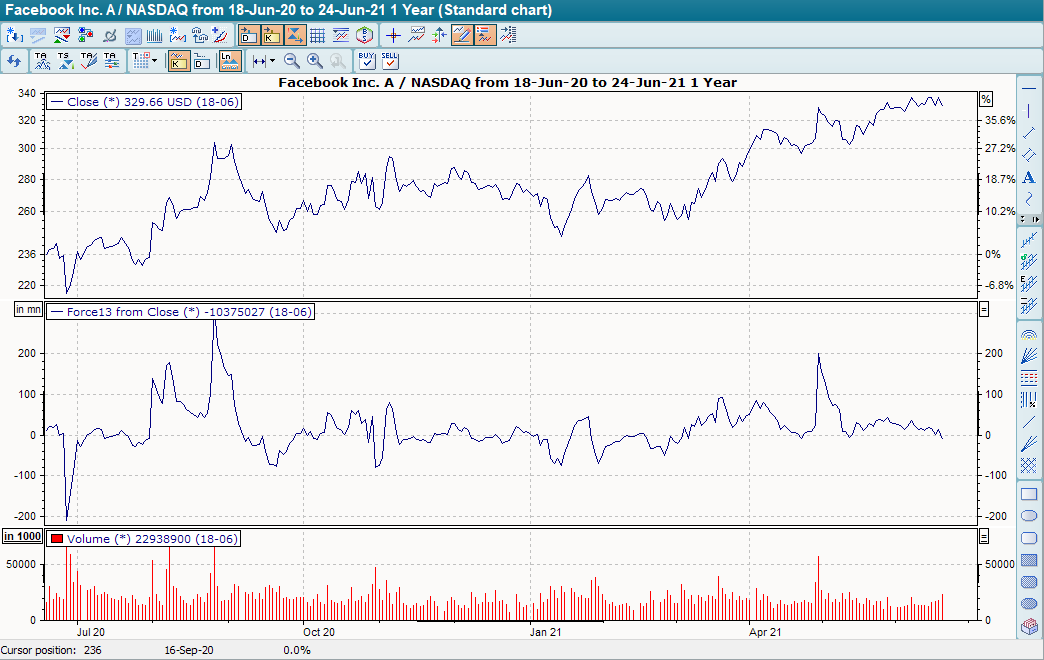
Only a one-day momentum is calculated for the Force Index and this value is multiplied by the respective turnover. The result therefore fluctuates very strongly above and below the zero line, as the values are positive on days with price gains and negative on days with price falls. The amount of the individual value depends on the turnover and the actual price movement.
In order to get a better grip on the strong fluctuations, the indicator is usually only displayed in smoothed form.
Formula/calculation
Force - Index =EMAx((Ct-Ct-1)*V
Interpretation
In general, two different interpretations are possible, on the one hand by breaking through the zero line and on the other hand by calculating a GD on the Force Index.
If the indicator breaks through the zero line from bottom to top, this is a buy signal. If the indicator breaks through the zero line from top to bottom, this is a sell signal. In this interpretation, the indicator is mainly displayed unsmoothed and as a histogram.
The other option is to calculate a GD on the Force Index and use the intersection of the two lines as a signal generator. A buy signal is given when the Force Index crosses its GD from bottom to top, a sell signal is given when the Force Index crosses its GD from top to bottom.

Default setting
-
Short term 2 days
-
Long-term 13 days
-
As signal generator GD a 9 day GD, exponential
Basic trading systems
-
Force Index
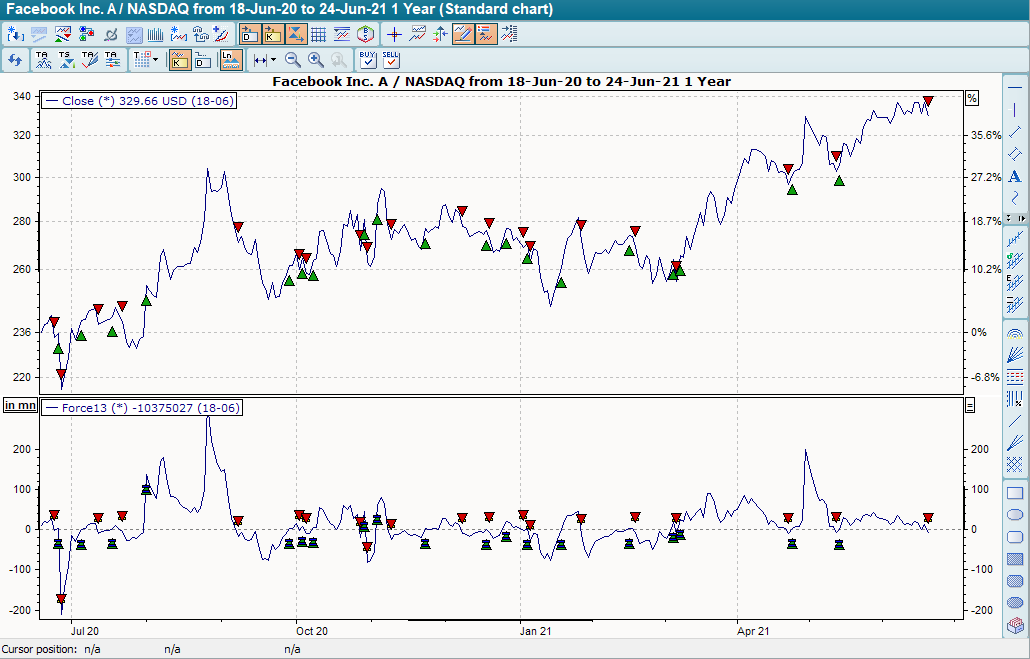
The default settings for the basic trading system "Force Index" are "13" for the period and "Exponential" for the method. The base trading system provides buy signals when the indicator breaks through the zero line from bottom to top and sell signals when it breaks through the zero line from top to bottom.