Type
Trend follower
Short introduction
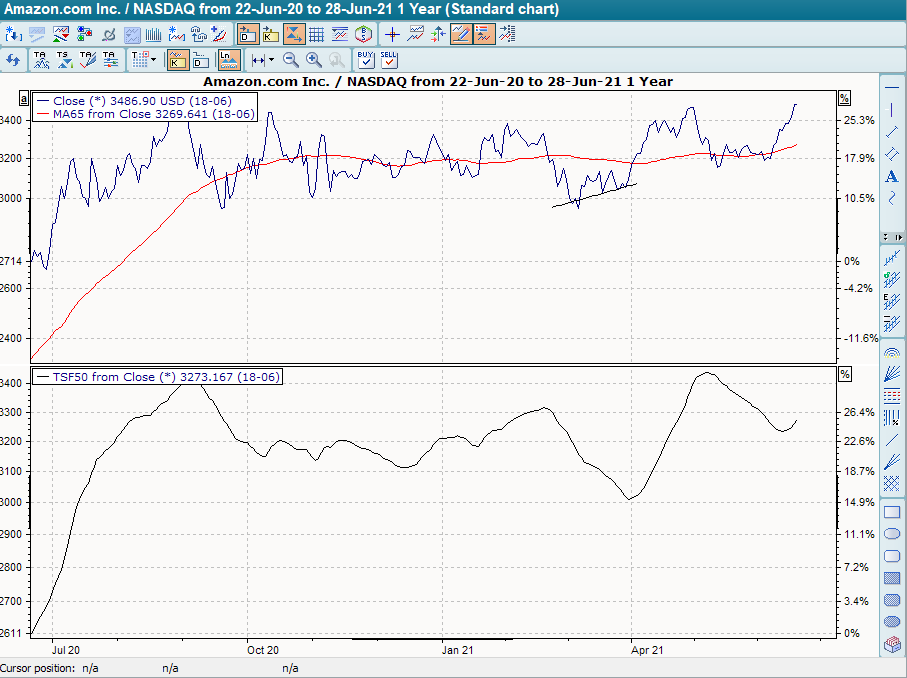
The Time Series Forecast (TSF) is similar to a GD in that it also attempts to approximate the trend of a security. In contrast to many other indicators, the mathematical background of this indicator is not very simple, but rather somewhat sophisticated.
Statement
The trend measurement is not carried out in the form of smoothing (see GD), but by calculating so-called regression lines over the course of the price. These measure the slope at exactly one point of the price trend. For more detailed background information on calculating a regression line, please refer to the specialist literature.
The individual points are combined to form a continuous progression that describes the trend of the underlying.
Formula/calculation
-
Calculation of a regression line ("R") over the last X-periods R fromCt-n toCt
-
The last point of this regression line represents the current "TSF" value: TSFt =Rt
-
The sequence of consecutively determined "TSF" values results in the "Time Series Forecast"
Interpretation
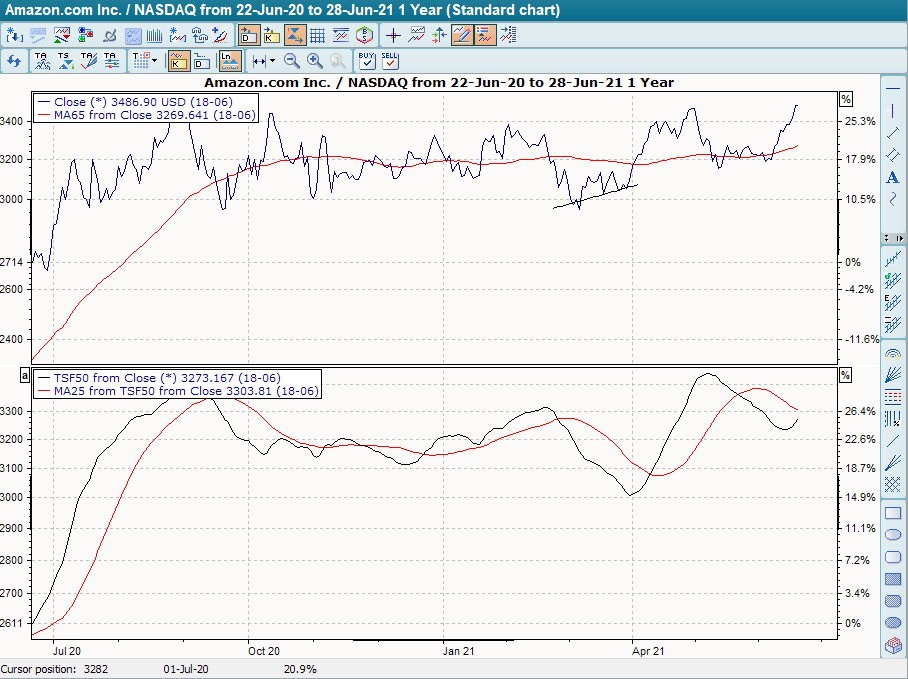
There are two different possible interpretations: Firstly, the intersection of the TSF with a GD calculated on it. A buy signal is given when the TSF crosses its GD from bottom to top, a sell signal is given when the TSF crosses its GD from top to bottom.
On the other hand, it is possible to examine the intersection of the TSF with the base value. A buy signal is given when the underlying crosses the TSF from bottom to top, a sell signal when the underlying crosses the TSF from top to bottom.
Please note that the TSF reacts very quickly due to its calculation, sometimes even too quickly. It should therefore always be used in conjunction with other indicators, such as a GD.
Default setting
-
The TSF is calculated daily, there are no setting options.
Basic trading systems
-
Time Series Forecast (TSF)
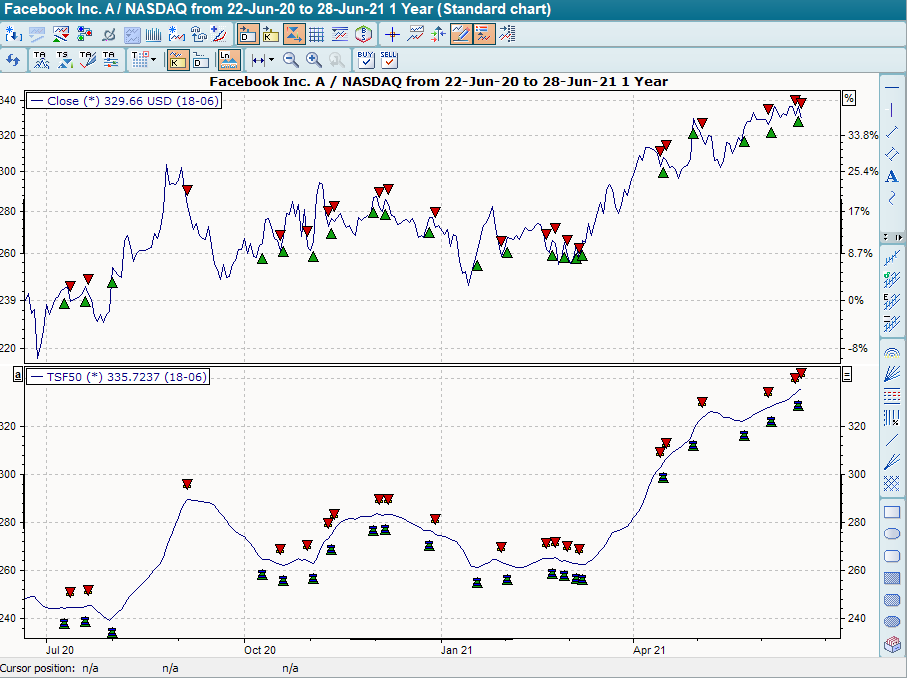
In the basic trading system "Time Series Forecast (TSF)", the period is set to 50 days. It provides buy signals when the close of the underlying crosses the TSF from bottom to top, and sell signals when the close of the underlying crosses the TSF from top to bottom.