To draw an indicator, first specify the time series to which the indicator is to be applied; otherwise the icon remains deactivated. You can calculate a moving average (GD), for example, on spot prices, on the turnover of the security or on a momentum. Each indicator can be applied to any time series, i.e. also to another indicator.
-
Select the time series for which the indicator is to be calculated by clicking on the price trend or the representation of the trend in the legend.
-

-
Select the indicator from the list that appears after clicking on the icon.
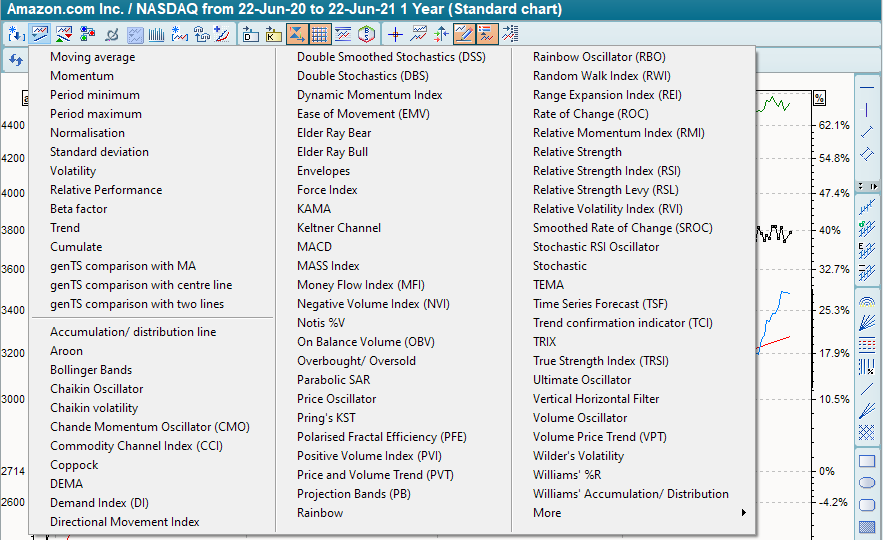
The indicator is plotted with its default settings.
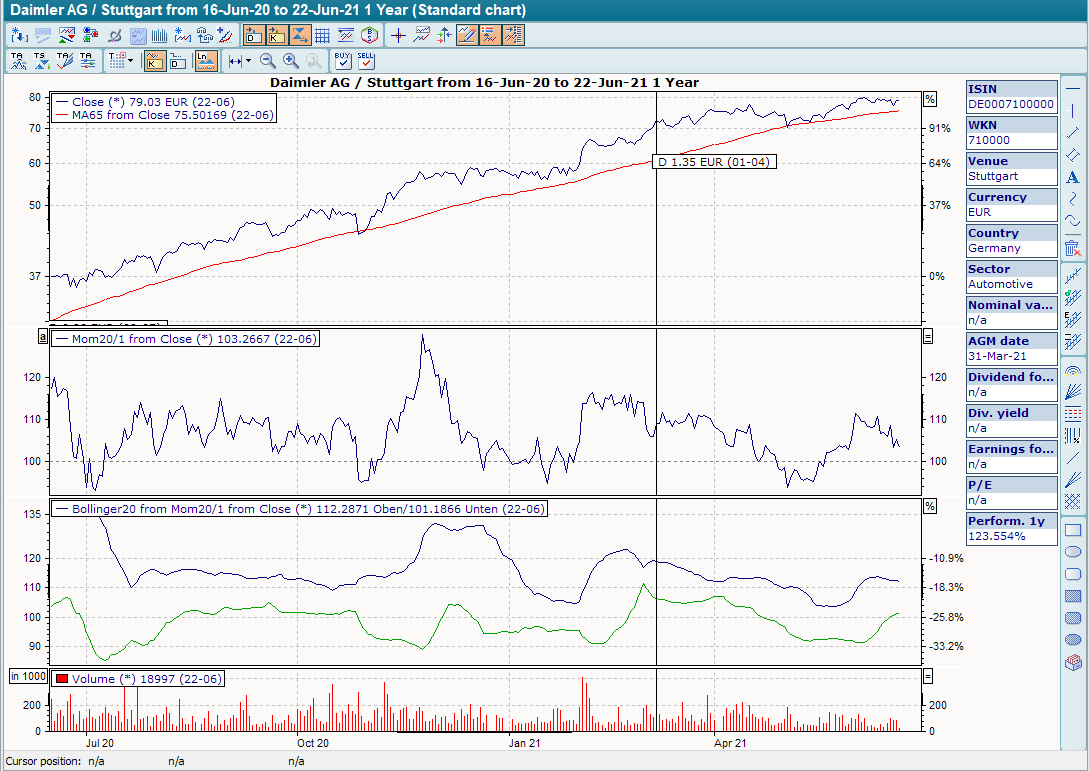
Trend followers are usually plotted together with the price trend, oscillators in a separate chart.
![]()