Type
Oscillator
Short introduction
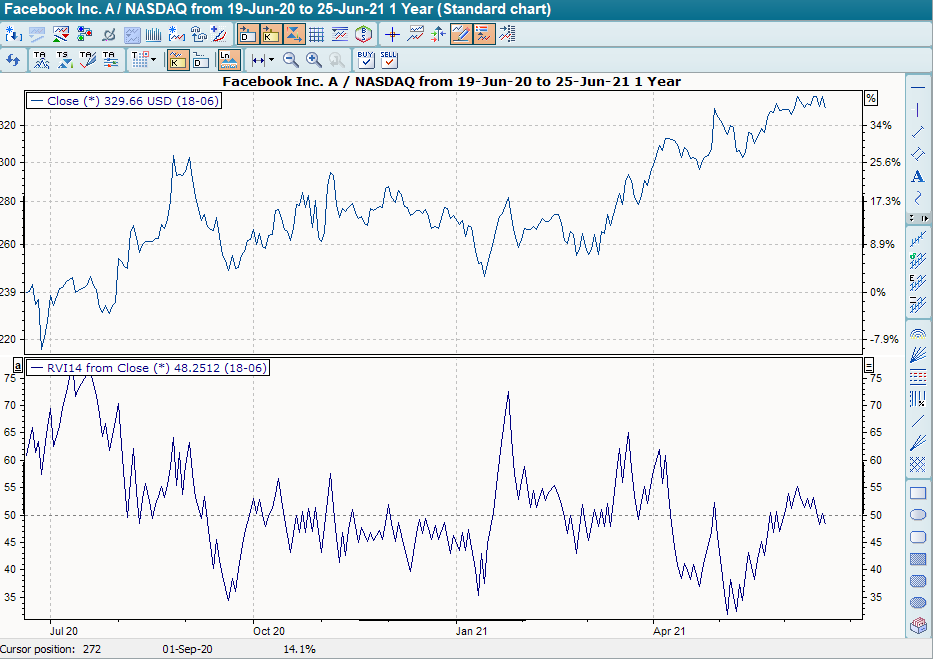
Donald Dorsey developed the Relative Volatility Index (RVI) on the basis of Wilder's RSI in order to have signals from other indicators confirmed by the development of volatility. The RVI does not provide its own signals.
Statement
The RVI ranges between 0 and 100, the center line is 50. As the calculation of this RVI is not trivial, we do not provide a precise derivation here. Readers interested in mathematics can take a closer look at the formula below.
Formula/calculation
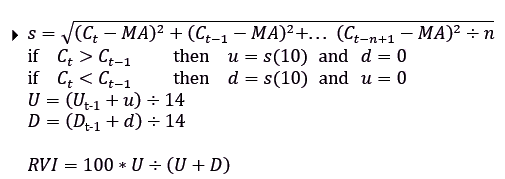
where:
s = standard deviation
U = average standard deviation of the last n up days
D = average standard deviation of the last n down days
Interpretation
The RVI itself does not provide any signals, it only has a confirmatory character. The RVI is positive when it is above 60; the opposite signal occurs when the RVI falls below 40. The RVI is negative when it is below 40, the opposite signal is generated when the RVI rises above 60.
Buy signals, which are generated on the basis of crossings with the GD, should only be observed if the RVI is above 50, sell signals only if the RVI is below 50.
One way to look for independent signals from the RVI is to examine divergences. A negative signal is given when the underlying asset is still forming new highs, while the indicator is no longer forming new highs; a positive signal is given when the actual price trend is still forming new lows, but the indicator is no longer forming new lows.
Default setting
-
daily, the GD is calculated over 14 days as standard.
Basic trading systems
-
Relative Volatility Index (RVI)
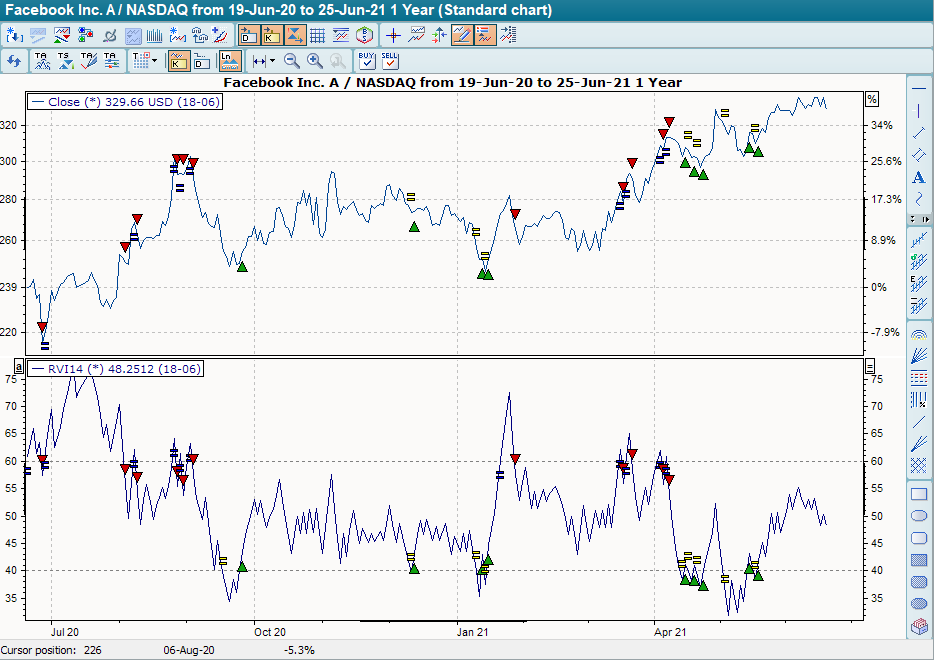
The basic trading system "Relative Volatility Index (RVI)" has a default setting of 14 days for the GD and 10 for the standard deviation period. In addition, two auxiliary lines are drawn at 60 and 40. It provides buy signals when the indicator breaks through the line at 40 from bottom to top. These are closed out if the indicator then breaks through this lower line from top to bottom. The base trading system provides sell signals when the indicator breaks through the upper line at 60 from top to bottom. Similarly, these are closed out if the indicator then breaks through the line at 60 from bottom to top.