Type
Market indicator, trend follower
Short introduction
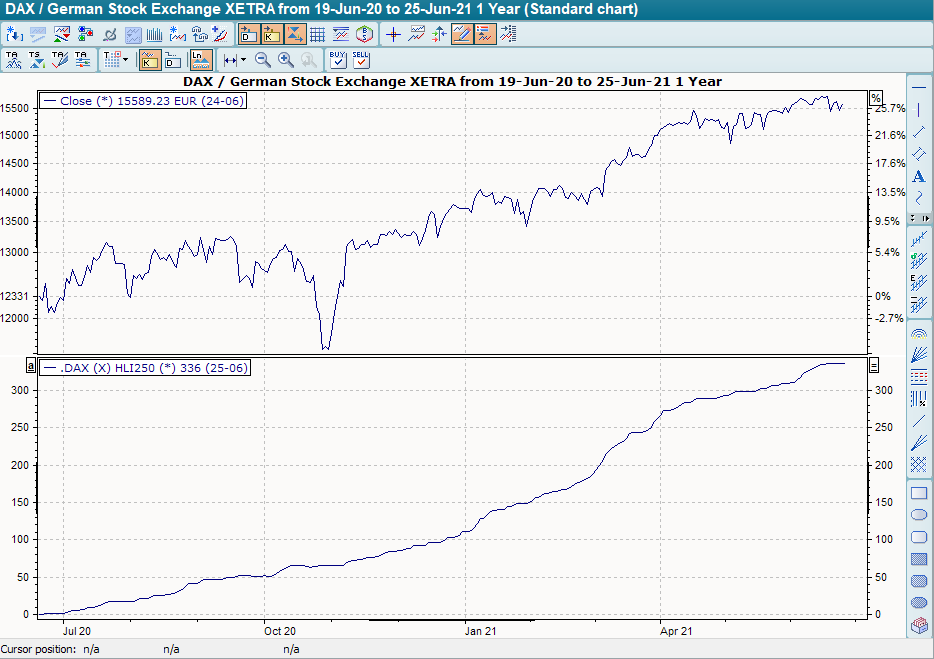
The market indicator "New High/New Low Index" (HLI) determines for a set of securities (index, index composition) how many securities have reached new highs or new lows in the selected period. This provides a very good indication of the state of the market.
Statement
The HLI compares the securities for which a new high price was reached in the period under review with those for which a new low price was reached. If the number of highs is greater than the number of lows, the HLI rises. If the number of highs is lower than the number of lows, it falls. If the number of new highs equals the number of new lows or if neither new highs nor lows were reached, the HLI remains unchanged.
Formula/calculation
if ∑WP (NewHighn) > ∑WP (NewLown)
then HLI = HLIt-1 + 1
if ∑WP (NewHighn) < ∑WP (NewLown)
then HLI = HLIt-1 - 1
if ∑WP (NewHighn) = ∑WP (NewLown)
then HLI = HLIt-1
Default setting
-
Period: 250 days
Basic trading systems
None