Type
Market indicator, oscillator
Short introduction
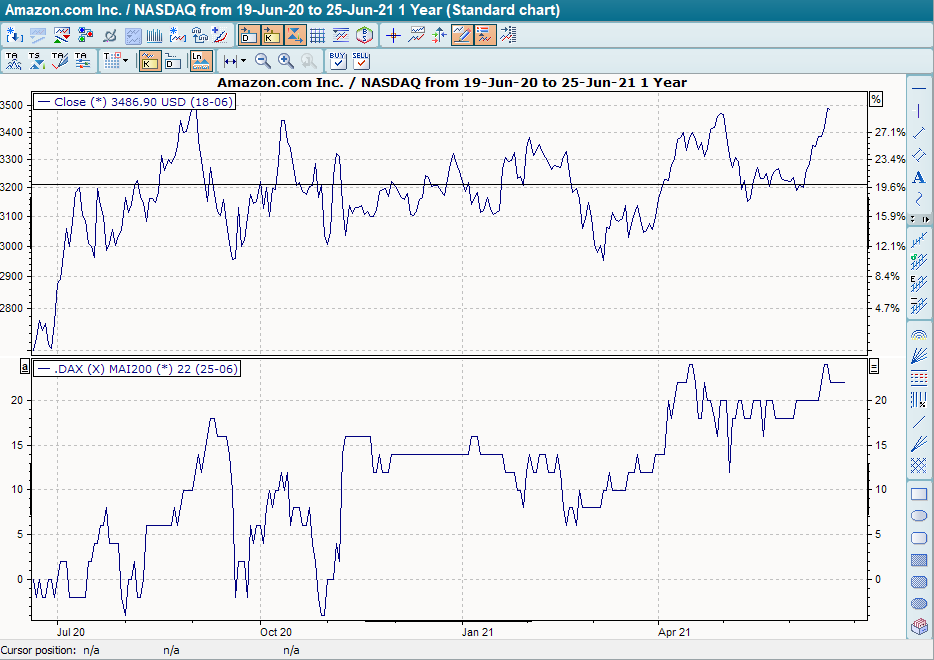
The market indicator "Moving Average Index" (MAI) tests how many prices of a set of securities (index, index composition) are above their moving average (GD).
Statement
The MAI compares the prices that are above their GD with those that are below their GD in order to make a statement about the situation of the observed market.
Formula/calculation
The MAI can assume the values 1, 0, -1.
is ∑WP (Close > GD) > ∑WP (Close < GD)
then MAI = 1
is ∑WP (Close > GD) < ∑WP (Close < GD)
then MAI = -1
is ∑WP (Close > GD) = ∑WP (Close < GD)
then MAI = 0
Interpretation
If the MAI has a value of 1, a positive trend can be seen for the observed market and time period. Conversely, an MAI of -1 indicates a negative market trend. At 0, the market is neutral.
If the MAI remains at 1 for a longer period of time, this can mean that the market is overvalued and prices will fall.
Default setting
-
Period: 200 days
Basic trading systems
-
None