Type
Trend follower
Short introduction
In addition to the actual prices, the Money Flow Index also includes turnover in the calculation. It represents a kind of "sales momentum". The typical abbreviation is "MFI".
Statement
The MFI is based on the idea that an investment is made in a security when the value closes near the high of the day. If the closing price is close to the daily low, money is withdrawn from the security.
The calculation is based on the so-called "typical price", which we have already introduced for the Commodity Channel Index. If the current price is higher than on the previous day, this is referred to as a positive money flow. If the current price is lower, this is referred to as a negative money flow.
The money ratio is calculated on the basis of these two figures. Finally, this ratio is standardized in order to obtain a representation that is easier to interpret. Due to the normalization, the MFI always fluctuates around the 50 line with a maximum of 100 and a minimum of 0.
Formula/calculation
Xt = (H + L + C) ÷ 3
ifXt ≥Xt-1, then+Yt =Xt × V and-Yt = 0.
ifXt ≤Xt-1, then+Yt = 0 and-Yt =Xt × V.
MR = ((+Yt) + (+Yt-1) + (+Yt-2) + ... + (+Yt-n+1)) ÷ ((-Yt) + (-Yt-1) + (-Yt-2) + ... + (-Yt-n+1))
MFI = 100 - (100 ÷ (1 + MR))
where:
X = Typical price
+Y = Positive money flow
-Y = Negative money flow
MR = money ratio
Interpretation
Due to its calculation, the MFI rises when prices rise and falls when prices fall. As turnover also plays a role alongside prices, strong movements in the MFI always indicate particularly high turnover or very strong price changes compared to the previous day.
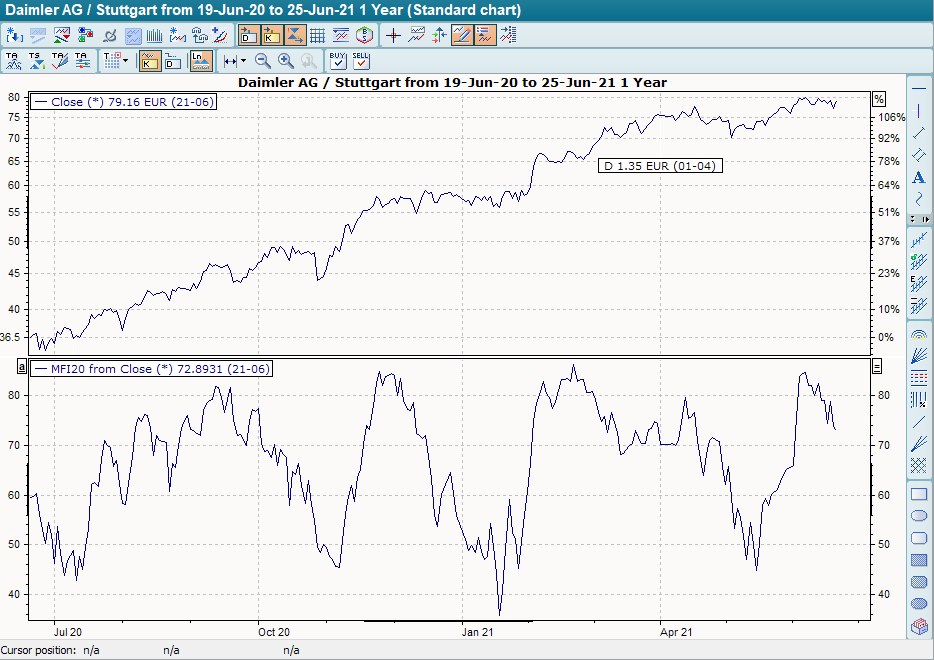
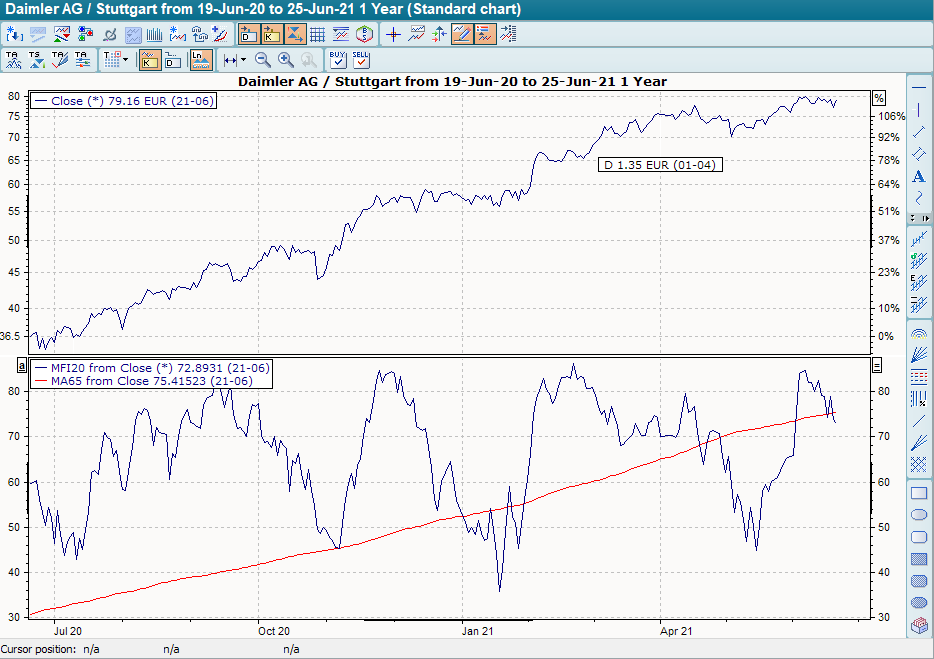
Crossing with the 50 line is interpreted as the standard signal. A breakout from the bottom to the top provides a buy signal, a breakout from the top to the bottom a sell signal. Alternatively, you can also place a moving average over the MFI and interpret the intersections between GD and MFI as a signal, similar to the MACD.
In addition to this interpretation, many analysts also use divergences between the underlying and the MFI to generate signals. If the price continues to rise, but the MFI is already falling, the upward trend is likely to end soon. The same applies in reverse if prices are still falling and the MFI is already rising.
Default setting
-
20 days
Basic trading systems
-
Money Flow Index (MFI)
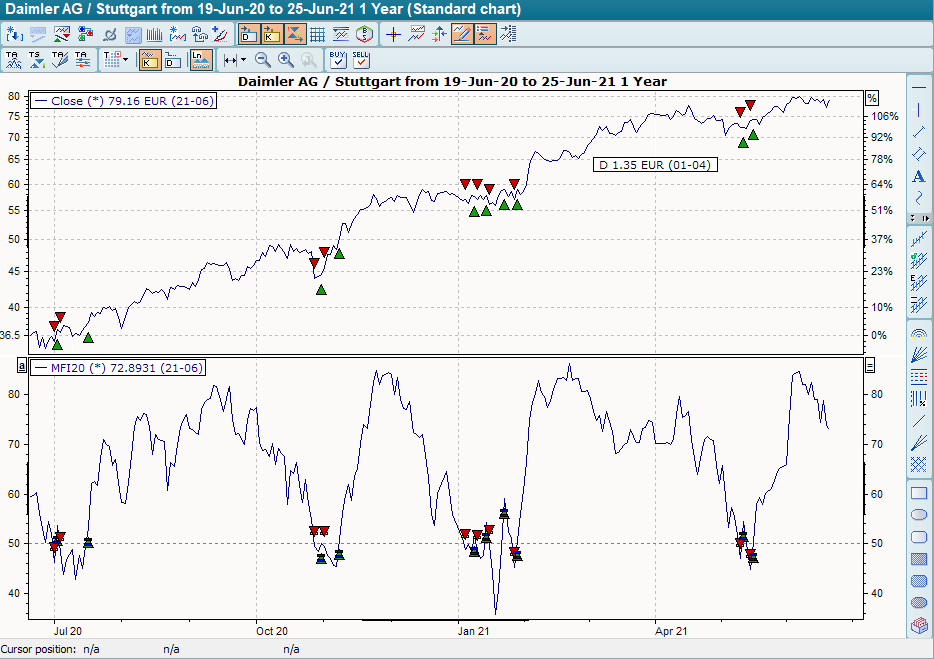
In the "Money Flow Index (MFI)" base trading system, the default setting for the period 20. In addition, the line at +50 serves as a signal line. The base trading system provides buy signals when the indicator breaks through this line at +50 from bottom to top, and sell signals when it breaks through to the bottom.