To edit the left axis, select the LEFT SCALE command in the "Edit chart elements" menu icon on the "Chart" tab. Optionally, you can also double-click on the left axis.
In the "Edit coordinate axes" dialog box, the settings for the left-hand axis are displayed on the "Vertical scale" tab.
You can change these options by clicking on the fields or checkboxes.
You can check your settings directly using the example window shown on the right.
Save all changes with "Apply".
You can also use this context menu to scale the vertical axis automatically (corresponds to the default setting) or as a percentage. To switch, select the PROCENTUAL SCALING command in the context menu of the left axis...In the following "Axis intercept" dialog box, set the percentage value of the difference between the maximum and minimum of the display.
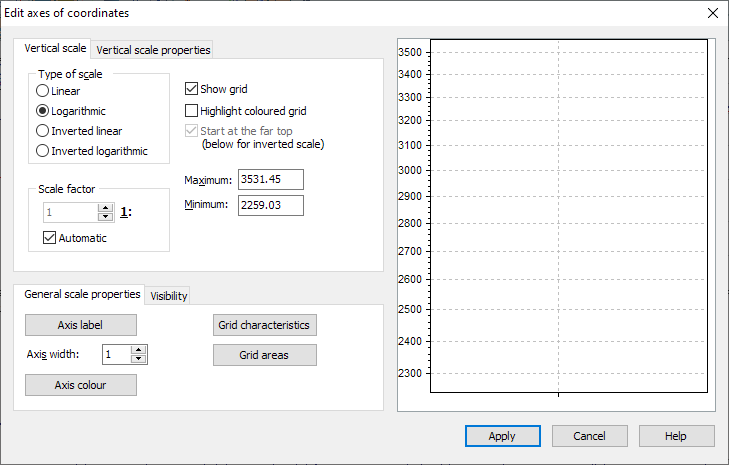
Options in the "Edit coordinate axes" dialog box
|
Field |
Description |
|---|---|
|
Scale type linear |
If this option is activated, the prices are displayed linearly. |
|
Scale type Logarithmic |
If this option is activated, the values on the left or right axis are always displayed at the same percentage distance. This means, for example, that a price movement of 10% is always displayed at the same distance on the axis, regardless of the absolute values. Negative figures (e.g. percentage economic data) cannot be scaled logarithmically as this is mathematically impossible. |
|
Scale type Inverted linear |
If this option is activated, the highest prices in the linear display are shown at the bottom and the lowest prices at the top of the vertical axis; normally this is the other way round. |
|
Scale type Inverted logarithmic |
If this option is activated, the highest prices in the logarithmic display are shown at the bottom and the lowest prices at the top of the vertical axis; normally this is the other way round. |
|
Maximum |
This value shows the highest scale value displayed. It is usually set automatically and should not be changed manually, as otherwise the highest prices may be lost or there may be too much "air" in the upper part of the chart. |
|
Minimum |
Indicates the lowest scale value shown. This value is usually set automatically and should not be changed manually, as otherwise the lowest prices may be lost or there may be too much "air" in the lower area of the chart. |
|
Scale factor |
Specifies which scale factor is used to display the time series. The scale factor is used to save some space in the display for large prices, for example in the sales area. |
|
Draw grid |
Deactivate this checkbox if you do not want the vertical guides (grid) to be displayed. |
|
Color contrasting grille |
Activate this checkbox to highlight the grid (two-colored). Now you can also define the position of the first grid line using the "Start at the top" checkbox, which is now active. |
|
Grid properties |
Specify the line properties and width of the grid. You can specify the color of the grid in the familiar dialog box. |
|
Grid surfaces |
Define the properties of the surfaces here in the same way as the line properties. |
|
Axis labeling |
You can specify the font for the axis label in the familiar dialog box. |
|
Axle color |
You can specify the color of the axis in the following dialog box. |
|
Axle width |
You can select a different axis width, the width is displayed in points. |
|
Visibility |
On the small "Visibility" tab, specify which axes are to be displayed. You can also set the right-hand axis as the default here. |
The settings on the "Vertical scale properties" tab can be found in the section Scale properties.