Portfolio Service Investment Agent" module or "Portfolio Service Rebalancing" module
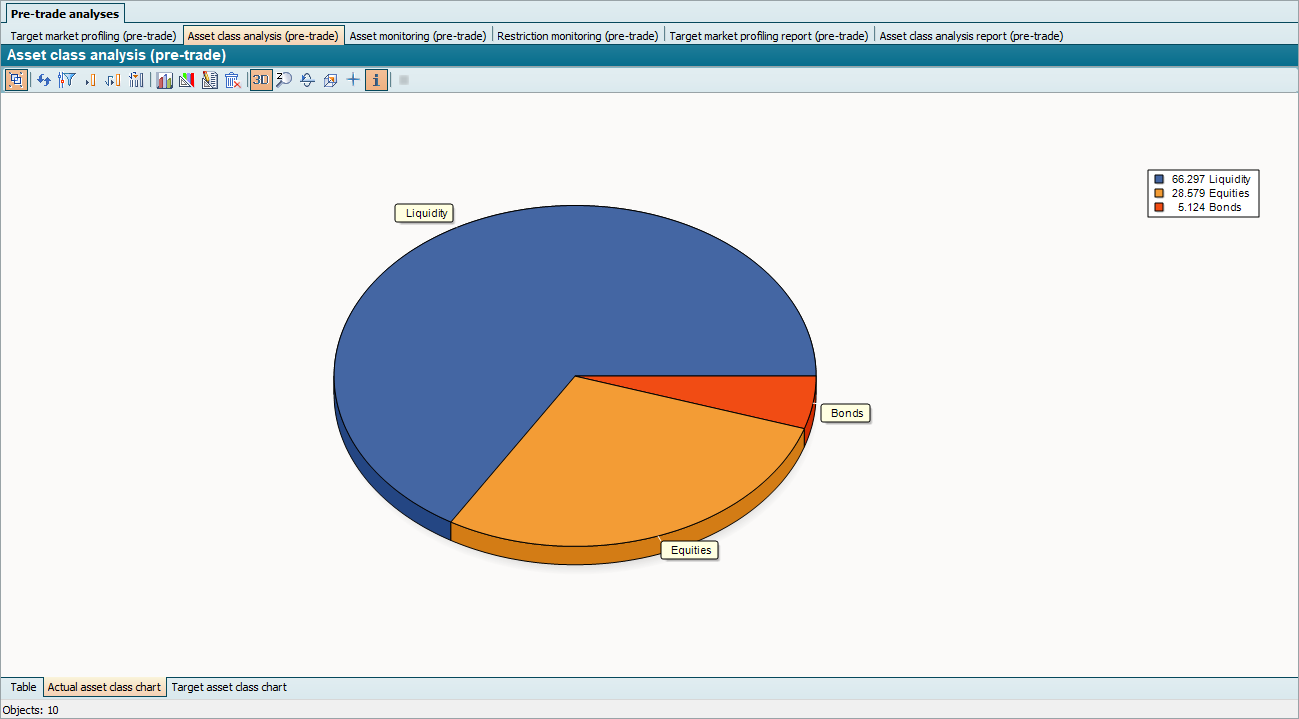
The "Asset class analysis (pre-trade)" opens as a table. In addition, two diagrams are also available for graphical analysis of the actual and planned values.
Select the "Actual asset class diagram" tab at the bottom of the window in the work area to switch to the display as a diagram for the actual status.
The pie chart shows the actual value share of the individual portfolio items in the assets, grouped by asset class.
Information on editing this display can be found in the chapter Diagrams.