Type
Combination trend follower/oscillator
Short introduction
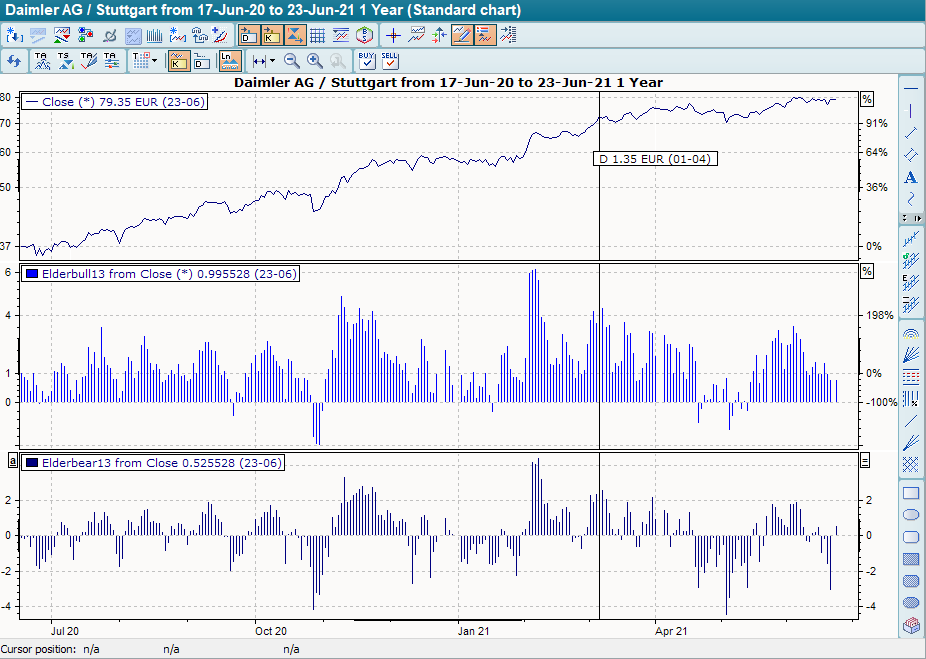
The Elder Ray, listed in the Infront Portfolio Manager as the separate indicators Elder Bull and Elder Bear, is a combination of a trend follower and an oscillator. The developer, Dr. Alexander Elder, is trying to screen the market with this indicator, similar to the way doctors do with X-rays. The term "Elder Ray" is only the generic term for the two actual indicators.
Statement
For both indicators, an exponential GD is calculated first; in the case of Bear Power, the GD is subtracted from the daily low; in the case of Bull Power, the GD is subtracted from the daily high.
A value above the zero line in the Bull Power indicates that the daily high is above the GD, a negative value indicates that the daily high (and thus all prices of the day) is below the GD. In Bear Power, a negative value means that the daily low is below the GD, while a positive value indicates that the daily low (and thus all prices of the day) is above the GD.
The display is usually in the form of a histogram.
Formula/calculation
Bull power = H -EMAx
Bear power = L -EMAx
Interpretation
The interpretation is done primarily by looking for divergences between the actual price trend and the two indicators. A negative signal is given when the underlying asset is still forming new highs, while the indicator is no longer forming new highs; a positive signal is given when the actual price trend is still forming new lows, but the indicator is no longer forming new lows.
Default setting
-
13 days
Basic trading systems
-
None