To change the settings, select the time series and choose the command TIME SERIES... from the context menu.
The positions differ depending on which chart form was selected. The general options (color, scale assignment, etc.) are described below, information on the special settings can be found in the chapters on the respective chart form.
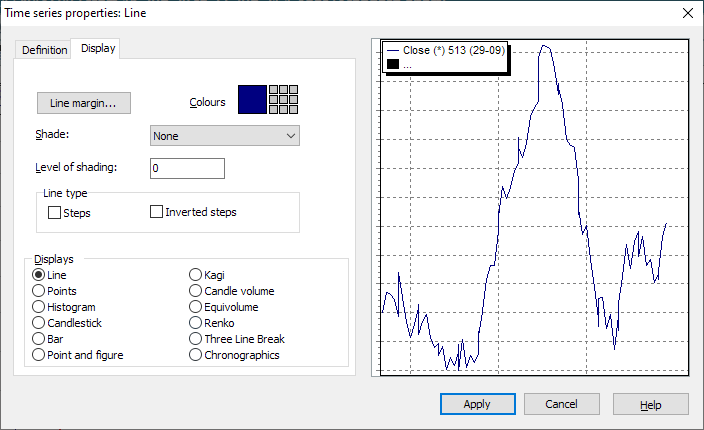
General settings for time series (Display tab)
|
Field |
Description |
|---|---|
|
Line edge |
Opens a dialog box in which you can define the color, style and width of the border. The position is relevant for the 3D display. |
|
Colors |
Double-click on the current color or the button to the right of it to open a dialog box in which you can define the color of the time series. The preset color does not always have to be the color of the time series, in some cases it can stand for the color in the legend (e.g. for point-and-figure charts). Use the nine smaller fields to define the colors for up to nine guide lines (if available). |
|
Sample |
You can select a different pattern from the list for the displayed line. This option is only relevant for display in 3D. |
|
Shading |
You can use this selection list to assign an individual shade to the chart line, e.g. "Band", "Level" or "Lower edge of display". Find out your personal favorites through tests. |
|
Representations |
Simply activate the desired option in the "Representations" field to switch to a different chart form. |
Line chart
In addition to the general settings, you can select the following options for line charts on the "Display" tab:
|
Field |
Description |
|---|---|
|
Line type Steps |
If this option is activated, two courses are not connected by a simple straight line, but by a right angle. With the simple steps, a horizontal line is drawn first, which then merges into a vertical line at a right angle.
|
|
Line type Inverted steps |
If this option is activated in addition to "Line type steps", the step is drawn inverted, i.e. first vertically upwards and then horizontally to the next course. |
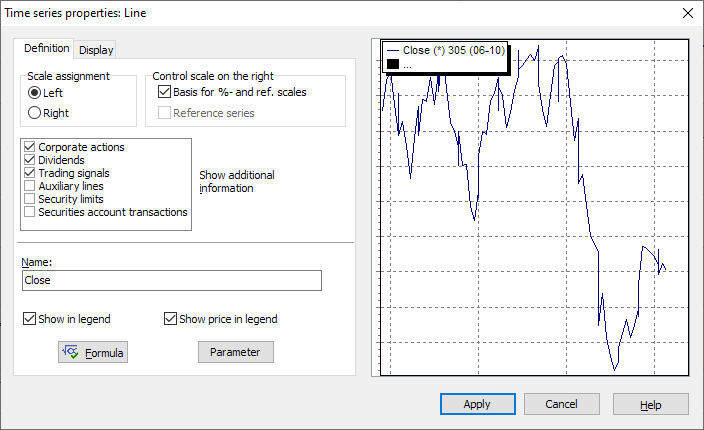
General settings for time series (Definition tab)
|
Field |
Description |
|---|---|
|
Scalesassignment |
Here you specify whether the left or right scale should be assigned to the price trend. The left-hand scale is standard. |
|
Basis for % and comparison scale |
Here you determine whether the selected time series should serve as the base time series for this chart. All time series that are displayed in the chart and defined as a comparison series are then always related to this time series and always displayed as a percentage of this time series. When a chart is created, the first time series is automatically defined as the base time series. The base time series is indicated by an asterisk (*) in the legend. You can use the context menu of the time series (or <SHIFT> + mouse click) to turn the base time series into a comparison series. |
|
Comparison series |
Here you specify whether a time series should be defined as a comparison series to an existing base series, in which case this time series is always displayed as a percentage of the base time series. The absolute values of this comparison series are then no longer shown. If you do not define a time series as a comparison time series, this time series is displayed on the same scale as the base paper. If you drag and drop a time series into an existing chart, for example, the new time series is automatically defined as a comparison series. Comparison series are indicated by a (V) in the legend. You can make the comparison series the base time series via the context menu of the time series (or with <SHIFT> + mouse click). |
|
Additional information |
Use these checkboxes to specify whether corporate actions such as par value changes or splits, dividends, trading signals or security limits should be displayed in the chart - if they exist. The information can also be shown or hidden using the corresponding icons in the toolbar. |
|
Show in legend |
Controls the display of the time series in the legend of the chart window. |
|
Show course in legend |
Controls the display of the price in the legend of the chart window. |
To define the formulas or set the parameters, read the chapter Working with course time series.