Type
Oscillator
Short introduction
The Ease of Movement Indicator was developed by Richard W. Arms, Jr. as an additional tool to his Equivolume charts. It combines momentum with an inertia measure derived from turnover and trading range. The smaller the price movements and the greater the volume, the more laborious and sluggish the price movements.
Formula/calculation
Arms uses the midpoint move, i.e. the previous day's difference between the mean value of the low and high, as the momentum. The mentioned inertia measure corresponds to the box ratio of the equivolume charts and is the ratio of sales to range. The ease-of-movement value is then the (usually exponential) smoothing of the quotient of momentum and box ratio, i.e. it represents a momentum oscillation damped by inertia.
mid-point= (L + H) / 2
mid-point-move=mid-pointt -mid-pointt-1
box-ratio= V / (H - L)
EMV=EMAn(mid-point-move / box-ratio)
where:
n = number of periods for smoothing
To make the scale easier to read, the volume (or EMC) is generally scaled with a power of 10.
Statement/Interpretation
The following literature is recommended for the statement and interpretation of the Ease of Movement:
-
Arms, Jr, Richard W.: Volume Cycles in the Stock Market, McGraw-Hill, 1987
-
Müller, Thomas and Lindner, Wolfgang: The big book of technical indicators, TM Börsenverlag
Default setting
-
n = 14
Basic trading systems
-
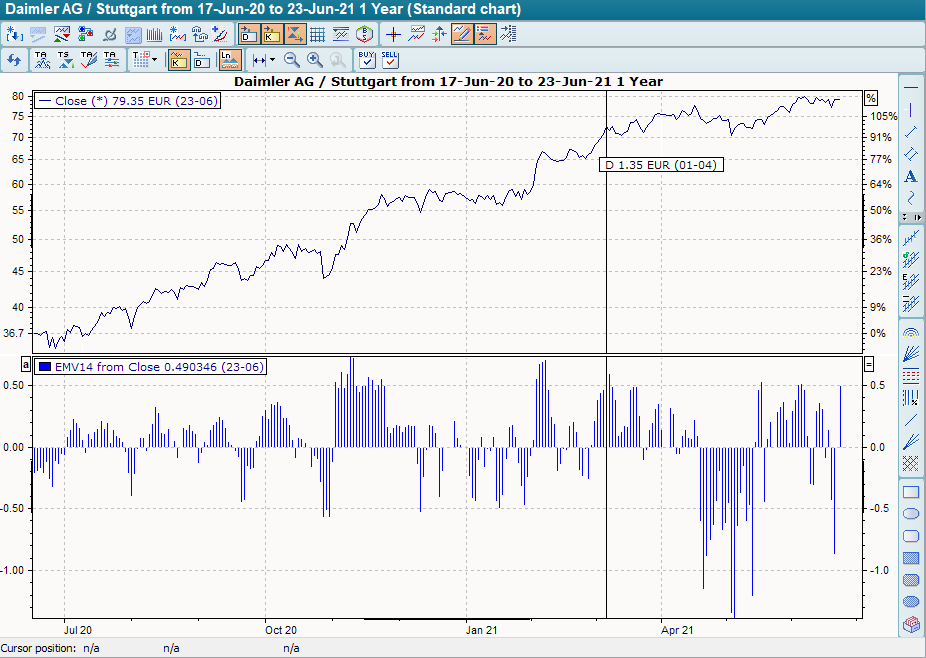
Ease of Movement (EMV)
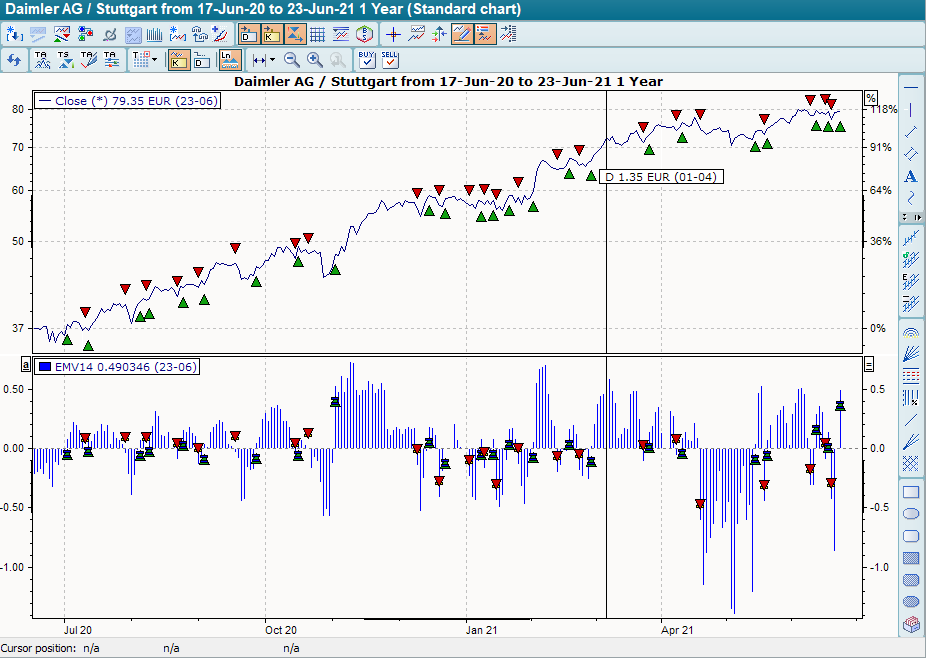
The basic trading system Ease of Movement (EMV) is drawn as a histogram around the zero line by default. The period is 14 days. It provides buy signals when the indicator breaks through the zero line from bottom to top. The base trading system provides sell signals when the EMV breaks through the zero line from top to bottom.