Type
Oscillator
Short introduction
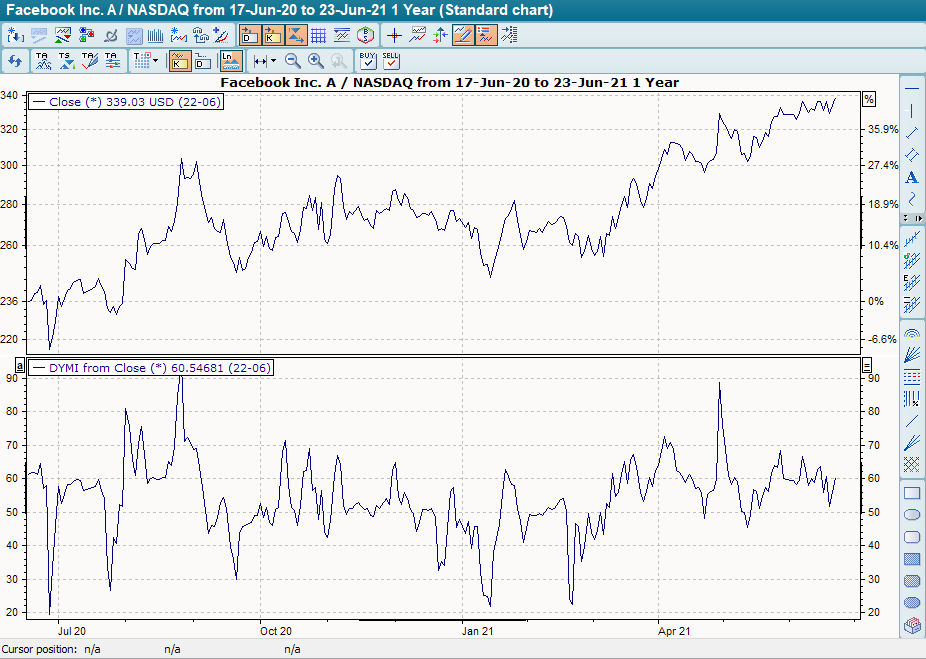
The Dynamic Momentum Index (DYMI) was developed by Tushar Chande and Stanley Kroll.
The DYMI is largely identical to Welles Wilder's Relative Strength Index, with the difference that the number of periods in the DYMI is variable (from 3 to 30). This variability makes it possible, for example, to take more periods into account in calm markets than in hectic markets.
Formula/calculation
See Relative Strength Index according to Welles Wilder and literature.
Statement/Interpretation
The following literature is recommended for the statement and interpretation of the Dynamic Momentum Index:
-
Chande, Tushar and Kroll, Stanley: Stochastic Rsi and Dynamic Momentum Index, Technical Analysis of Stocks & Commodities, 5/1993
-
Müller, Thomas and Lindner, Wolfgang: The big book of technical indicators, TM Börsenverlag
Default setting
-
Periods between 3 and 30
Basic trading systems
-
Dynamic Momentum Index
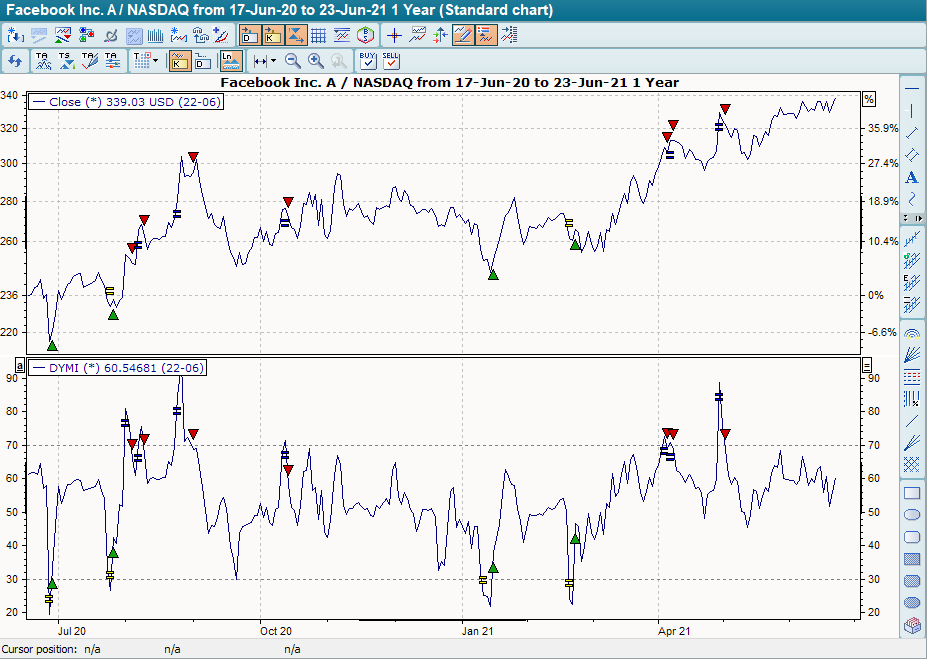
The Dynamic Momentum Index base trading system observes the indicator's behavior at the +30 and +70 lines in its default setting. It provides buy signals when the indicator breaks through the line at +30 from bottom to top. These are closed from top to bottom when the line at +30 is broken. The base trading system provides sell signals when the DYMI breaks through the line at +70 from top to bottom. These are closed out when the indicator breaks through the line at +70 from bottom to top.