In the toolbar of the chart window, you can set the most popular time periods with one click. Proceed as follows:
-

-
Select the desired time period from the drop-down menu.
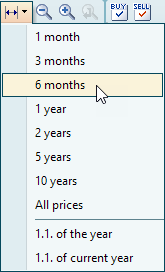
The chart is displayed in the selected time range.
If Intraday Online Service is switched on, the settings 1 day and 1 week are also available at the top of this selection list, as well as "Whole days" below. The Intraday Online Service is a module that requires a license.
You can set individual, deviating time periods by double-clicking on the time scale in the "Edit coordinate axes" dialog box. More on this in the section Timeline.