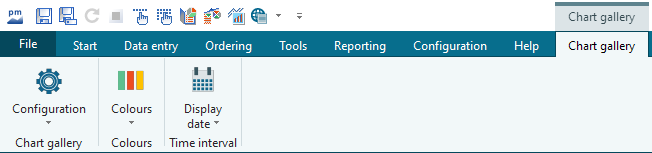
As soon as you open the chart gallery, the "Chart gallery" tab is added to the vwd portfolio manager ribbon. There you can modify various settings of the chart gallery.
All commands in this menu refer to the entire chart gallery.
Scaling
You can change the price range of the charts using the PROCENTUAL SCALING command in the menu of the "Configuration" icon on the "Chart gallery" tab. By default, the most volatile security in the chart gallery determines the percentage spread. This is the only way to ensure that all the (small) charts shown are really comparable. If, for example, chart 1 makes full use of the range, while chart 2 is at the lower end, this means that security 1 has effectively risen accordingly.
You can use the MAXIMUM VOLATILITY command in the "Configuration" icon menu to set the maximum volatility displayed. The default value is 201 %. Stocks whose price range exceeds 201% (overvolatile stocks) are excluded from the comparison. The overvolatile values are highlighted in light red in the chart gallery.
By selecting the commands LEFT SCALES VISIBLE and TIME SCALES VISIBLE in the menu of the "Configuration" icon, you determine which scales are to be displayed. The left-hand scale and the time scale are visible by default.
The time period is set automatically as long as the command TIME INTERVAL AUTOMATIC is activated in the menu of the "Display date" icon. However, you can set the time period as you wish by selecting FIRST DISPLAY DATE or LAST DISPLAY DATE in the
Enter a different day in the "Display date" icon menu.
Representation
To optimize the overview, you can also change the number of columns or adjust the height and width of the charts. To do this, select the corresponding command from the "Configuration" icon menu and enter the desired numbers in the following dialog box. The default setting is four columns; the individual charts displayed are each 201 pt high and 201 pt wide.
You can use the "Colors" menu icon to change the default settings for the BACKGROUND, the color of the currently SELECTED CHARTS or the color of the OVERVOLATILE CHARTS.