Lines
|
Element |
Description |
|---|---|
|
Line(s) |
One or more lines displayed on the chart for the trading system. Auxiliary lines are usually horizontal lines that generate a signal for the trading system (such as the 30 line in the RSI) or simply indicate certain price levels. |
Signal sequences
|
Element |
Description |
|---|---|
|
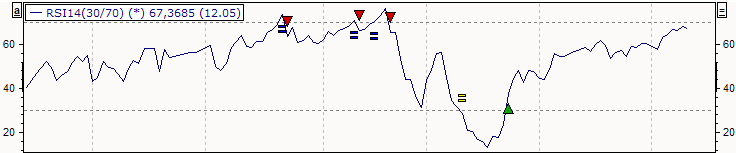
Long signals |
Green triangle upwards below the chart line.
|
|
Short signals |
Red triangle downwards above the chart line.
This means that any long positions are closed and a short position is opened on the basis of short signals. The security is therefore sold short. |
|
Close-long signals |
Yellow equal sign above the chart line ("close signal"). Signal to end a long phase, but without opening the opposite position at the same time. This is often referred to in the literature as a sell signal, but this is not entirely correct. This is because a sell signal also means that in this case the opposite position, i.e. also the sale of a non-existent position (short sale), is executed. |
|
Close-short signals |
Blue equal sign below the chart line. Signal to end a short phase, but without opening a long position at the same time. |
|
Limit abort |
Red equal sign above or below the chart line, depending on whether a long or short phase is interrupted by the loss limit. |
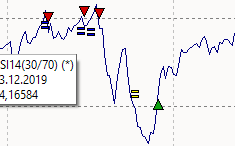
If you move the mouse over a signal marker, a yellow information window appears. More on this in the following section.
In simple signal mode
|
|
|

In adjusted mode
|
Start of trading phase
|
|
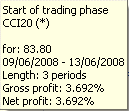
|
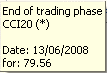
End of trading phase
|
|