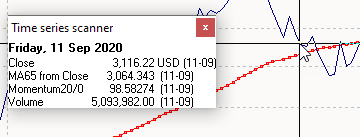
In the Infront Portfolio Manager you can display a vertical line, the so-called scan line, in the chart and move it across the chart on a daily basis. At the same time, the "Time series scanner" window opens in the chart window. This window shows the date on which the scan line is located and the price on this date.
This allows you to analyze each individual price on the chart for each trading day to the nearest decimal place and immediately identify breakouts or formation outbreaks.
If you have also displayed a comparison value, e.g. an index, the value of this title is also displayed.
-
Unknown Attachment Activate the time series scanner with the "Scan" icon.
-
Move the cross to the desired position in the chart.
-
You can move the vertical scan line using the <ARROW LEFT> and <ARROW RIGHT> cursor keys. To scan the displayed time series(s). Each press of the button shifts the scan line by one unit of the set consolidation period in the desired direction, e.g. one day forwards or backwards when set to "daily".
-
You can move the scan line to any point on the course by moving the line to the appropriate position with the mouse.
If you hold down the <CTRL> key during the "Daily" consolidation period, you can use the <LEFT ARROW> and <RIGHT ARROW> cursor keys to jump week by week and the <CTRL>+<SHIFT> keys and cursor keys to jump month by month.
The time series scanner is deactivated by clicking on the "Scan" icon again. Alternatively, you can also click on the "Close" icon at the top right of the "Time series scanner" window.