-
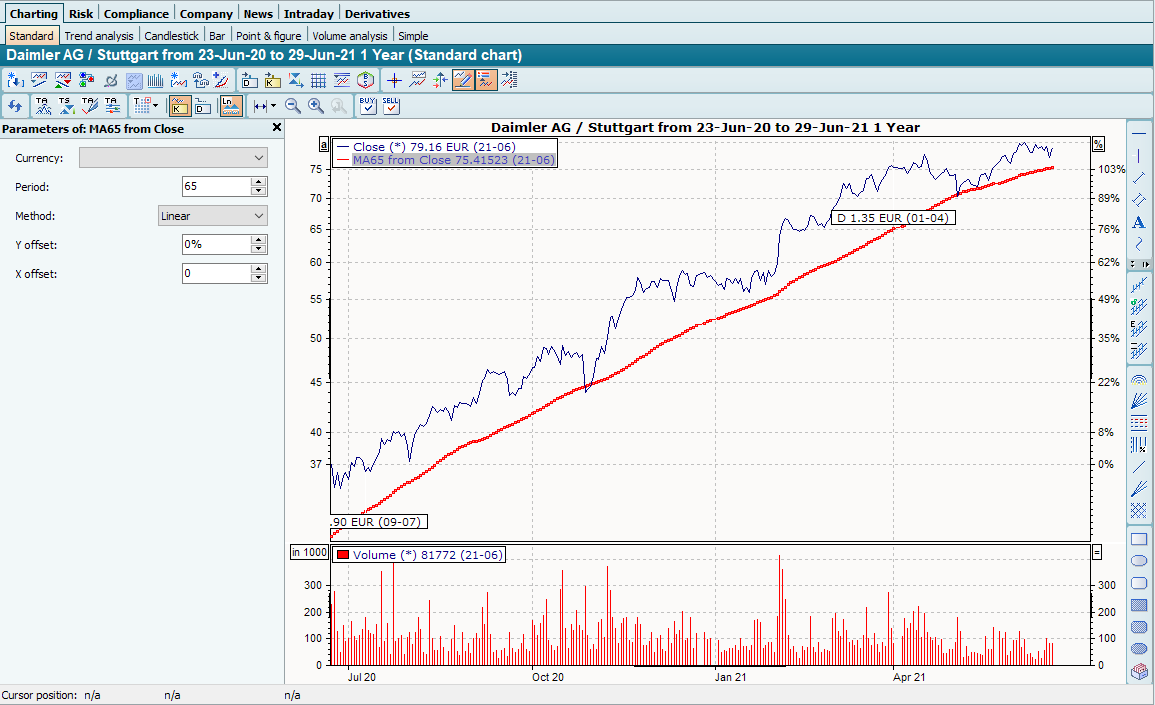
Proceed as follows to edit a time series in the chart:
-
Select the price history and choose the command TIME SERIES in the context menu.
Or choose the command PROPERTIES on the "Chart" tab in the ribbon of the Infront Portfolio Manager. -
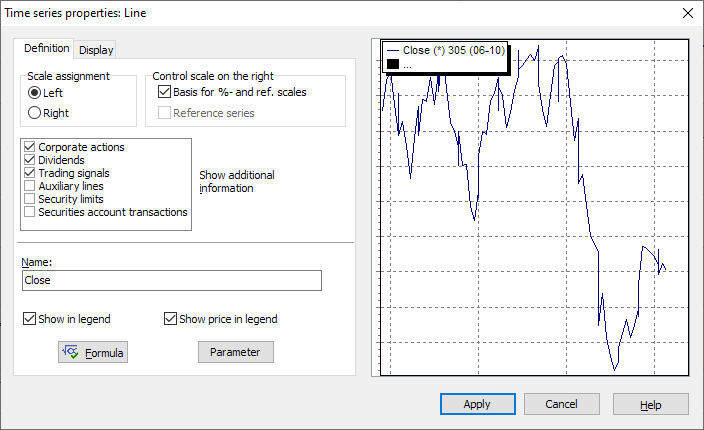
The "Time Series Properties" dialog box appears, in which you can switch between the "Display" and "Definition" tabs. The settings for the "Display" tab have already been described in the chapters on the respective chart form.
Definition" tab
In the "Definition" category, the name and calculation formulas of the time series are displayed. You can edit these settings by clicking on the fields or buttons.
Under the "Definition" tab, in addition to the allocation and parameter settings, you will also find the scale allocation and the display of additional information (such as dividends, corporate actions, etc.).
Save all changes by clicking on "Apply". To exit the respective dialog (without saving the changes), select "Cancel".
Settings on the "Definition" tab
|
Field |
Description |
|---|---|
|
Designation |
Enter a name for the time series here. Normally, the name is automatically specified in the Infront Portfolio Manager; you can overwrite the default. The designation can also contain dynamic text. To do this, enter placeholders by embedding the variable name in dollar signs: $variable name$ If, for example, you have defined a time series that depends on a 'period' parameter (e.g. the moving average) and the current setting of this parameter is to be displayed in the legend, GD$period$ from Close would be a suitable designation scheme for this time series. |
|
Assignment |
Each time series can also be given an assignment name in addition to the designation. These names can be used to link user drawings to the time series instead of the template. If a user drawing has the assignment specified here, it is plotted in every chart that has a time series with this assignment. |
|
Formula |
This button takes you to the formula editor. Here you can view or change the underlying formula if necessary. The formula editor is documented in detail in the MM-Talk reference. |
|
Parameters |
Here you can define the parameters of the time series. Read the following subsection Setting parameters. |
|
Show in legend |
If this checkbox is activated, the price history is displayed in the legend. If you deactivate the checkbox, only the graphic is displayed. |
|
Show course in legend |
If this checkbox is activated, the price of the security is displayed in the legend. |
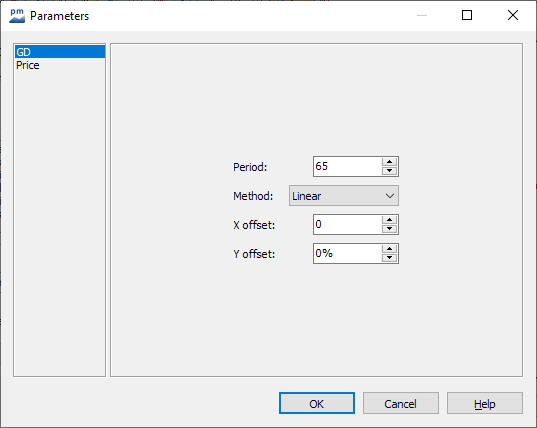
Set parameters
You can access the parameters via the PARAMETERS command in the context menu of a selected time series, the <CTRL>+<A> key combination or via the Fade PARAMETERS IN AND OUT command in the menu of the "Parameters" icon on the "Chart" tab.
By clicking on another time series in the legend, you can change its parameters. This change only affects the indicator that you are currently editing.
The parameters and basic settings for the various indicators can be found in the chapter on indicators. All indicators from the Infront Portfolio Manager are described in detail there, including the calculation and default settings.
Alternatively, you can access the parameters in the "Time series properties" dialog box, "Definition" tab, by clicking on the "Parameters" button.
Below you will find a typical parameter dialog window for GD and Price. The dialog boxes for the other indicators have a similar structure; the names of the parameters are adapted to the respective indicators.