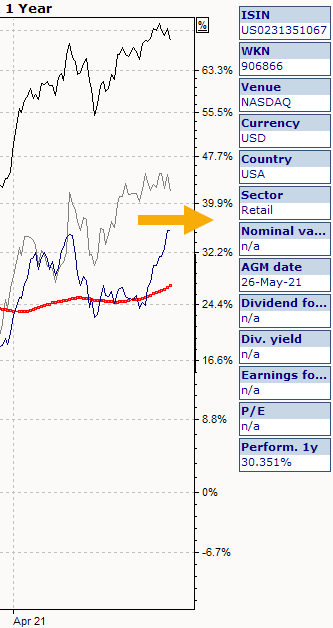
In addition to the pure price movements, you can also display fundamental and quantitative data in the chart window via the security profile.
![]()
The profile is displayed on the right-hand side of the chart window.
The security profile is hidden again by selecting the command SECURITY PROFILE on the "Chart" tab or selecting the icon again.
Edit securities profile
-
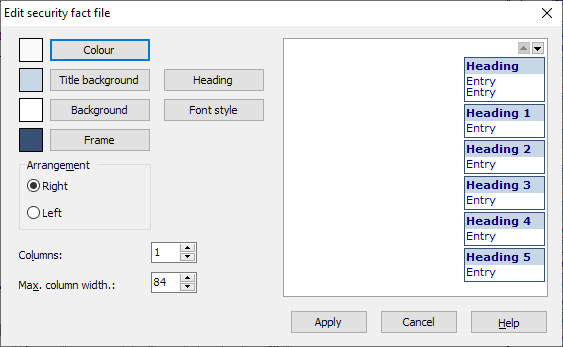
To edit the security note, select the command SECURITY NOTE on the "Chart" tab in the menu of the "Edit chart elements" icon. The "Edit securities profile" dialog box appears.
-
You can change the options by clicking on the fields or checkboxes. You can immediately see the result of your changes in the right-hand window.
-
Save all changes by clicking on "Apply".
Options in the "Edit securities profile" dialog box
|
Field |
Description |
|---|---|
|
Colors and font |
Select the corresponding button. The colors and fonts of the legend are defined in the following dialog boxes. |
|
Arrangement |
Choose between "Right" and "Left". |
-
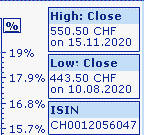
If you drag a selected close time series over the first entry in the profile, the high and low of the set time period are displayed in the profile.
-

-
To print out the security factsheet, select the FILE, PRINT command and activate the "Print security factsheet" checkbox on the "Charts" tab in the "Print chart" dialog box.
-
You can also change the order of the fields in the securities profile directly in the chart table using drag & drop.