Type
Oscillator
Short introduction
The Trix was developed by Jack K. Hutson and corresponds to a rate of change (ROC) of a triple-smoothed exponential moving average.
Statement
Triple smoothing really eliminates all non-significant "price outliers" from the chart. First, an exponential GD is formed from an exponential GD from an exponential GD, i.e. a triple exponential GD. Normally, a 1-day ROC is calculated on this trend.
Formula/calculation
Tt =EMAt (EMAt (EMAt (EMAt (log(Close))))
where the following applies to the first EMA:
EMA1t = a * log(Closet) + (1-a) *EMAt-1
TRIX itself is the percentage rate of change of the triple exponentially smoothed moving average (Tt):
TRIXt = 100 * (Tt -Tt-1) /Tt-1
Interpretation
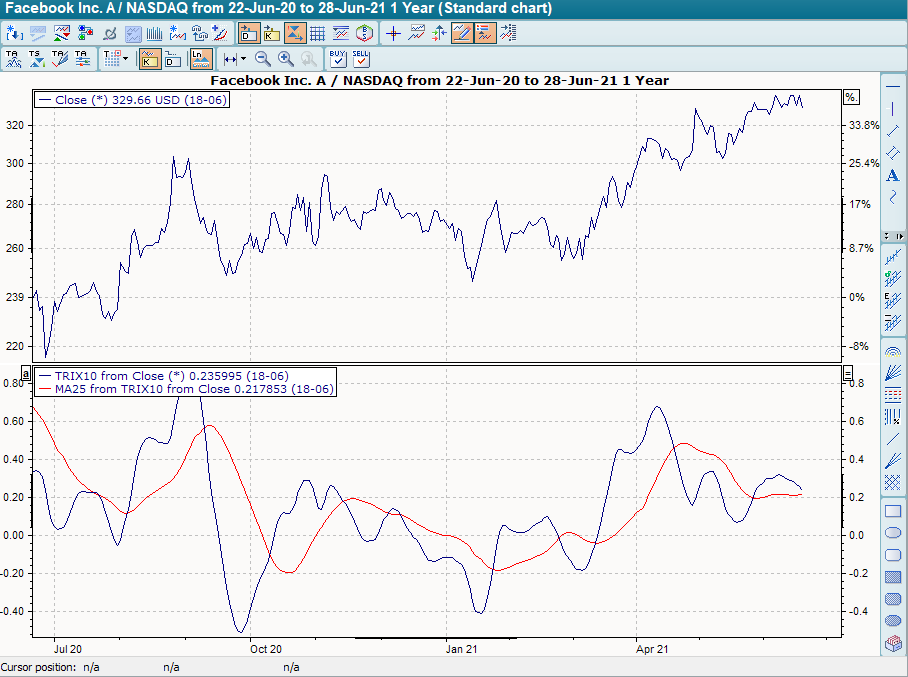
The course of the Trix, just like a GD, shows the current trend in the underlying security. Since the indicator reacts very slowly due to the multiple smoothing, it is not recommended to use the crossing of the zero line as a signal generator (see also ROC and Momentum). It makes more sense to place a GD over the actual Trix and interpret the interfaces as signals.
A buy signal is given when the Trix crosses its GD from bottom to top, a sell signal when the TRIX crosses its GD from top to bottom.
As a test, you can also use any ROC in Infront Portfolio Manager instead of the standard one-day ROC.
Default setting
-
A clear standard is not known, but very short periods of max. 15 days are often used for the GD of the Trix; a 1-day ROC is always used in the literature.
-
A 5-day GD is often used to generate signals.
Basic trading systems
-
Trix
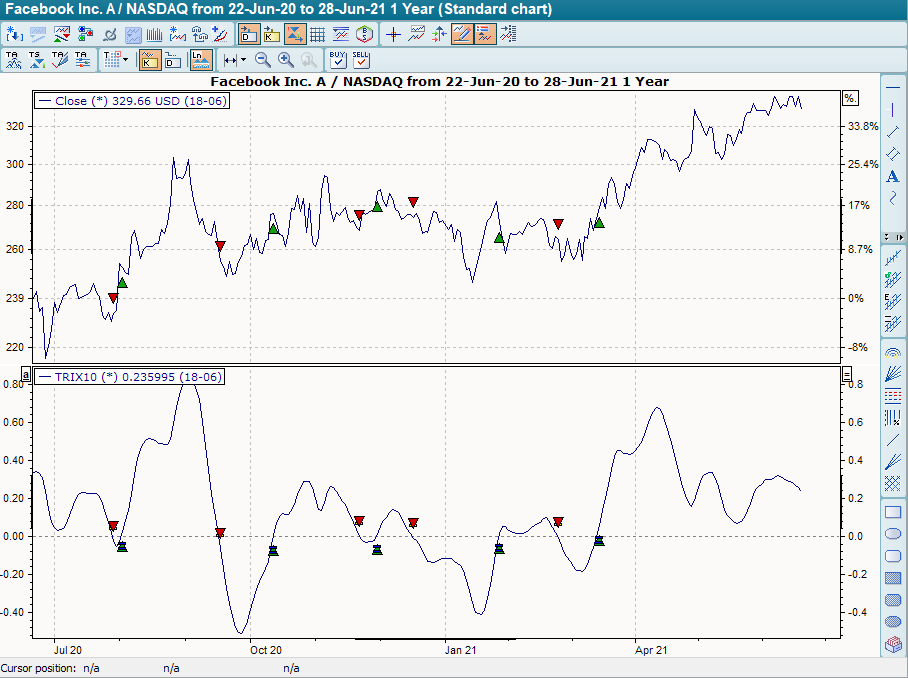
The basic trading system "Trix" is set to a period of 10 by default. It provides buy signals when the indicator breaks through the zero line from bottom to top, and sell signals when the indicator breaks through the zero line from top to bottom.