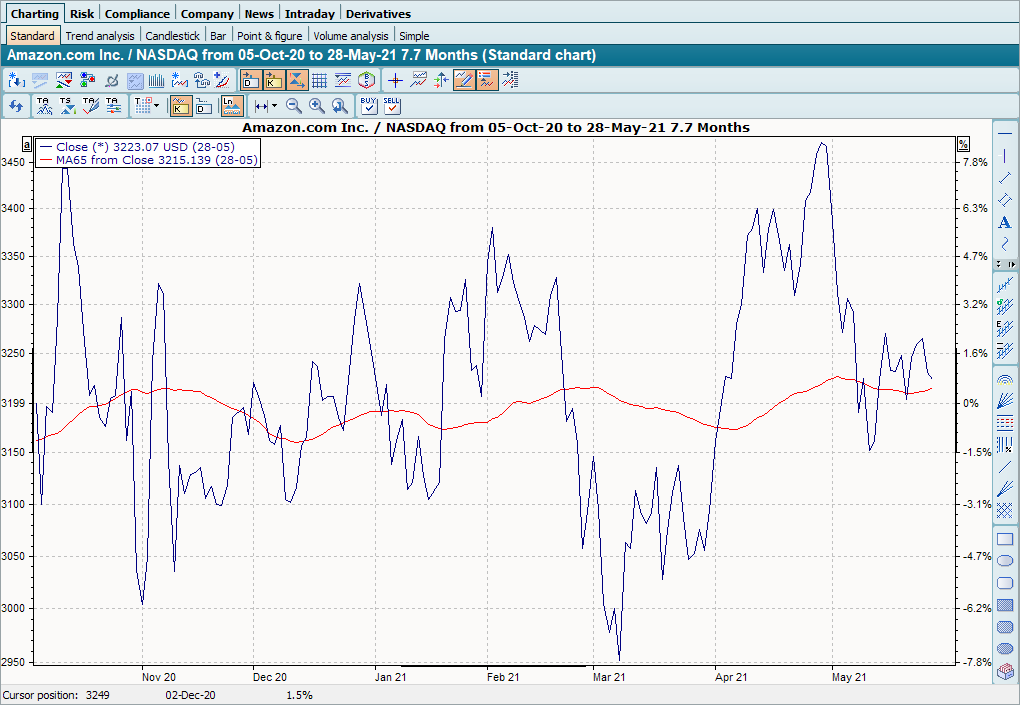
These indicators try to show or follow the current trend of the paper. A trend exists when the high and low points in the chart either rise (upward trend) or fall (downward trend). If this is not the case, the market is said to be trendless.
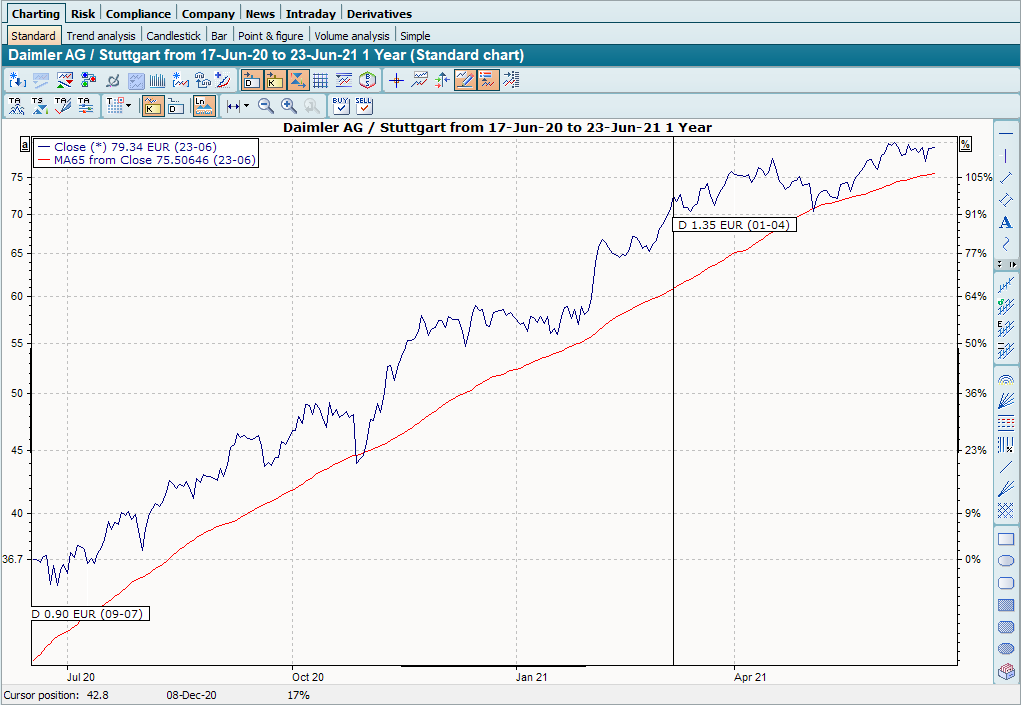
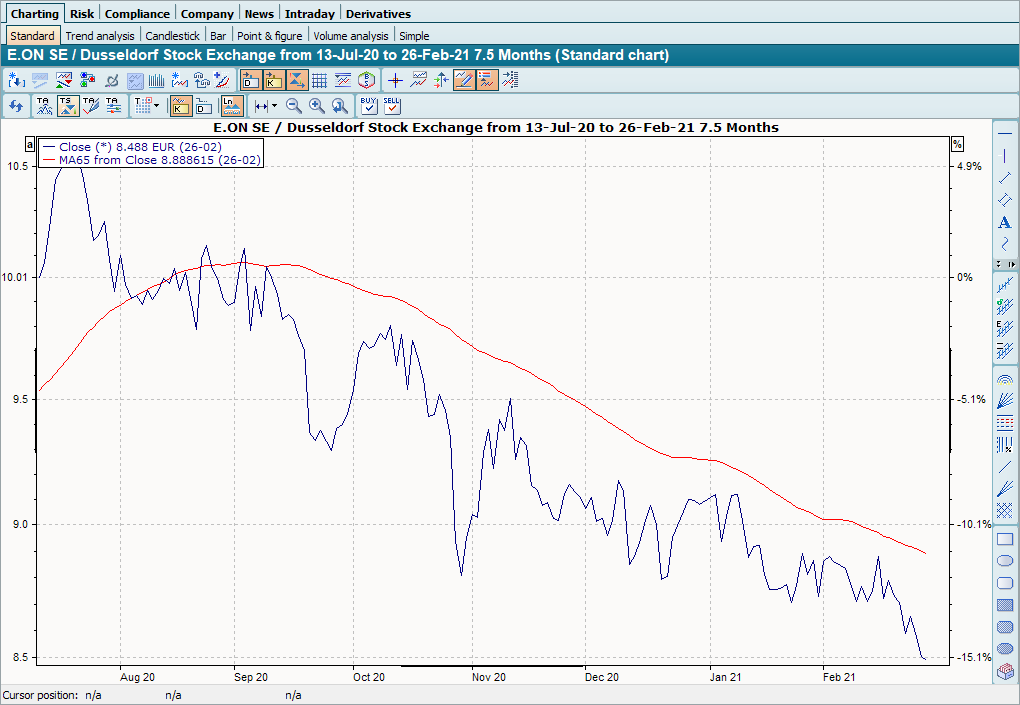
The disadvantage of this type of indicator is that it really only follows the trend, i.e. it lags behind. A signal to enter or exit therefore only occurs when a new upward or downward trend has formed. At this point, the first percentage points are usually already "lost".
This inertia makes trend followers particularly suitable for stock market phases with long, pronounced trends. In sideways trends, on the other hand, the trend sequences provide many false signals. For example, if the trend follower has just identified a new trend, the prices start to move in the opposite direction at exactly the same time - and they are on exactly the wrong side of the market. Unfortunately, it is not the case that you can derive a rule from this and use the indicator as a contra-indicator.
The trend followers say nothing about the strength of a trend or possible exaggerations. They merely indicate whether a trend exists or not.