Advanced Technical Analysis" module
-
Select the time series for which trend signals are to be calculated. If you do not select a time series, the formations are evaluated for the base time series.
-

Any existing formations are evaluated and the trend signals are plotted on the price chart.
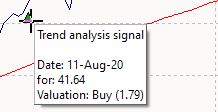
If you "hover" over the signals with the mouse (without clicking), an information window with the date, price and evaluation of the signal is displayed.
-
By clicking on the signal, the formations on which the signal is based are plotted on the chart.
Here, too, you can obtain detailed information by "hovering" with the mouse over the formations shown (do not click!).
Read the sections Evaluation of the formations and Change parameters (trend analysis).
You can remove all formations and signals at the same time by selecting the REMOVE command in the context menu of the "TS" flag.
Details on the information windows
|
Element |
Description |
|---|---|
|
Date |
The date on which the signal is delivered. |
|
With |
Current price on the designated date. |
|
Rating |
Evaluation of the signal. An overall rating greater than 1 is a buy signal, a rating less than -1 is a sell signal. |