In addition to taking the benchmark into account, this version of "Report Performance report" also contains illustrative graphics. You can find the "Performance report with graph" in the Portfolios workspace on the "Reporting", "Performance" worksheet, for example.
In addition to "Report Performance report", the "Performance report with graphics" presents the performance achieved in clear graphics.
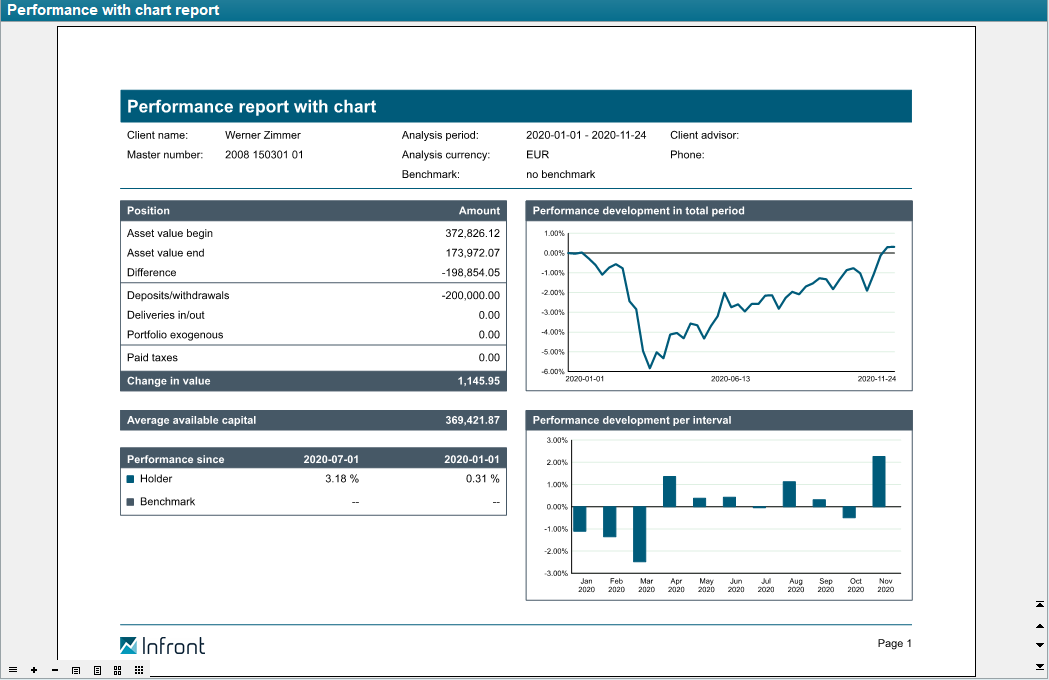
Line graph (chart)
The line chart gives you a quick overview of the performance development of the portfolio and benchmark over time.
Use the "Interval line diagram" parameter to set the points in time for the performance measurement in the diagram.
Bar chart (column chart)
The height of the columns in the chart symbolizes the percentage performance of the portfolio and benchmark in the respective interval. You can also set these intervals via the parameters.
You can access the parameters as usual using the <CTRL>+<A> key combination, for example.