To show the right axis in the chart, select the command RIGHT SCALES VISIBLE in the menu icon "More view options" on the "Chart" tab. This method also applies to hiding the axis.
Proceed as follows to edit the right-hand axis:
-
Select the RIGHT SCALE command in the "Edit chart elements" menu icon on the "Chart" tab.
Optionally, you can also double-click on the right axis in the chart window or call up the AXIS SCALE... command via the context menu for the axis.
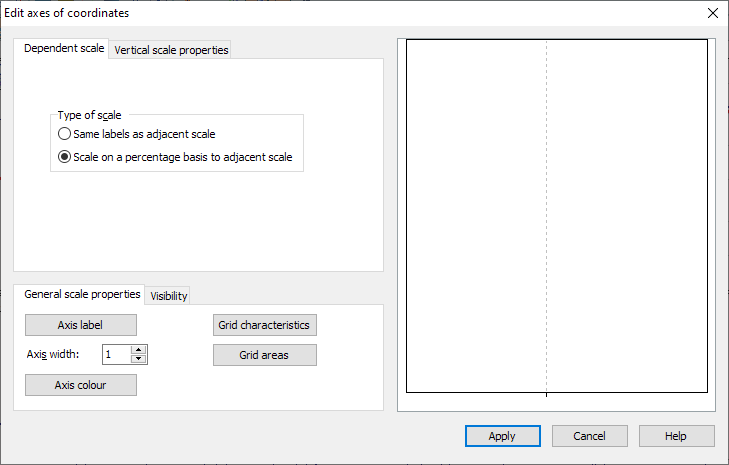
The settings for the right axis are displayed in the "Edit coordinate axes" dialog box, usually on the "Dependent scale" tab, as the right axis is usually based on the left axis. If you assign a time series to the right-hand axis, the "Vertical scale" tab is displayed accordingly. -
You can change these options by clicking on the fields or checkboxes.
You can check your settings directly using the example window shown on the right-hand side of the dialog box. -
Save all changes by clicking on "Apply".
Options in the "Edit coordinate axes" dialog box
|
Field |
Description |
|---|---|
|
Same labeling as scale opposite |
Here you determine whether the right-hand axis is to be labeled with the real prices or with the percentage values. As a rule, this field is deactivated; this means that the absolute values apply for the left-hand scale and the percentage values for the right-hand scale. The first available price is defined as 100%. |
|
Percentage scaling to scale vs |
Here you determine whether the right-hand axis is to be labeled with the real prices or with the percentage values. As a rule, this field is activated; this means that the absolute values apply to the left-hand scale and the percentage values to the right-hand scale. The first available price is defined as 100%. |