Type
Trend follower
Short introduction
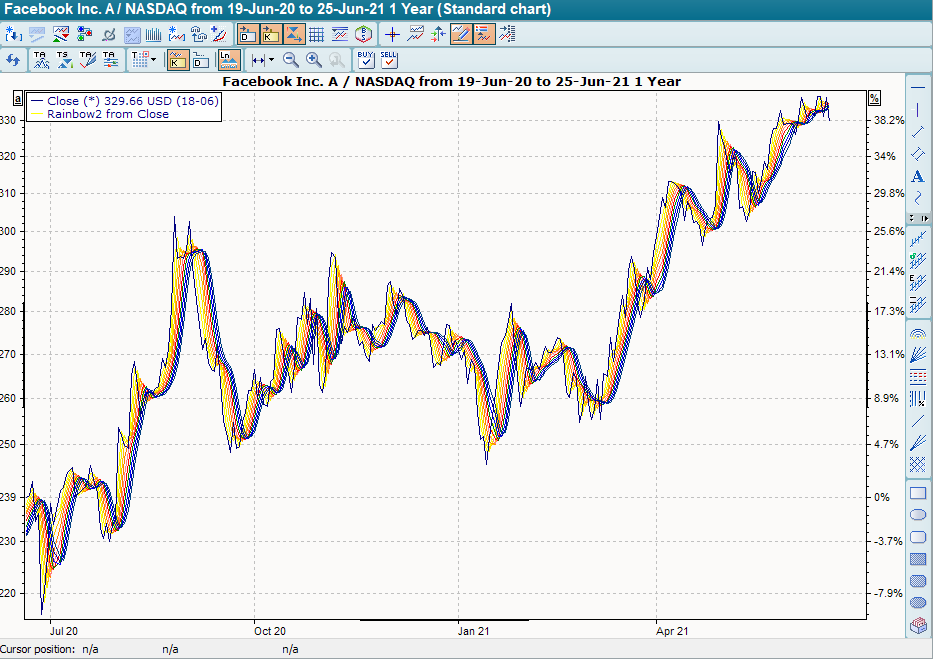
With the visually very appealing indicator Rainbow, its developer, Mel Widner, tries to visualize a whole spectrum of trends with the help of (rainbow) colors and thus help the analyst to reach his target at the "end of the rainbow". It should be borne in mind that short-term (day-to-day) fluctuations, for example, are signals for day traders, but merely "noise" for long-term investors.
Formula/calculation
Recursive smoothing" transfers the close prices to the rainbow chart. The following applies to the close time seriesCm with m = 1 to n, n = number of periods:
AVE1m = 0.5 * (Cm +Cm-1) for m = 2 to n
AVE2m = 0.5 * (AVE1m +AVE1m-1) for m = 3 to n
AVE3m = 0.5 * (AVE2m +AVE2m-1) for m = 4 to n
...
AVE10m = 0.5 * (AVE9m +AVE9m-1) for m = 11 to n
where:
AVE1, AVE2, ... = Averages for the respective points in time
Statement/Interpretation
The following literature is recommended for the statement, interpretation and extension of the Rainbow formula:
-
Widner, Mel: Rainbow Charts, Technical Analysis of Stocks & Commodities V15:7, pages 289-297
Default setting
-
Period = 2
Basic trading systems
-
None