You can modify and optimize the display of the performance chart, e.g. change the time period or draw a comparison value. Almost all the options of the "normal" chart window are available for display and formatting. More on this in the chapter Chart analysis.
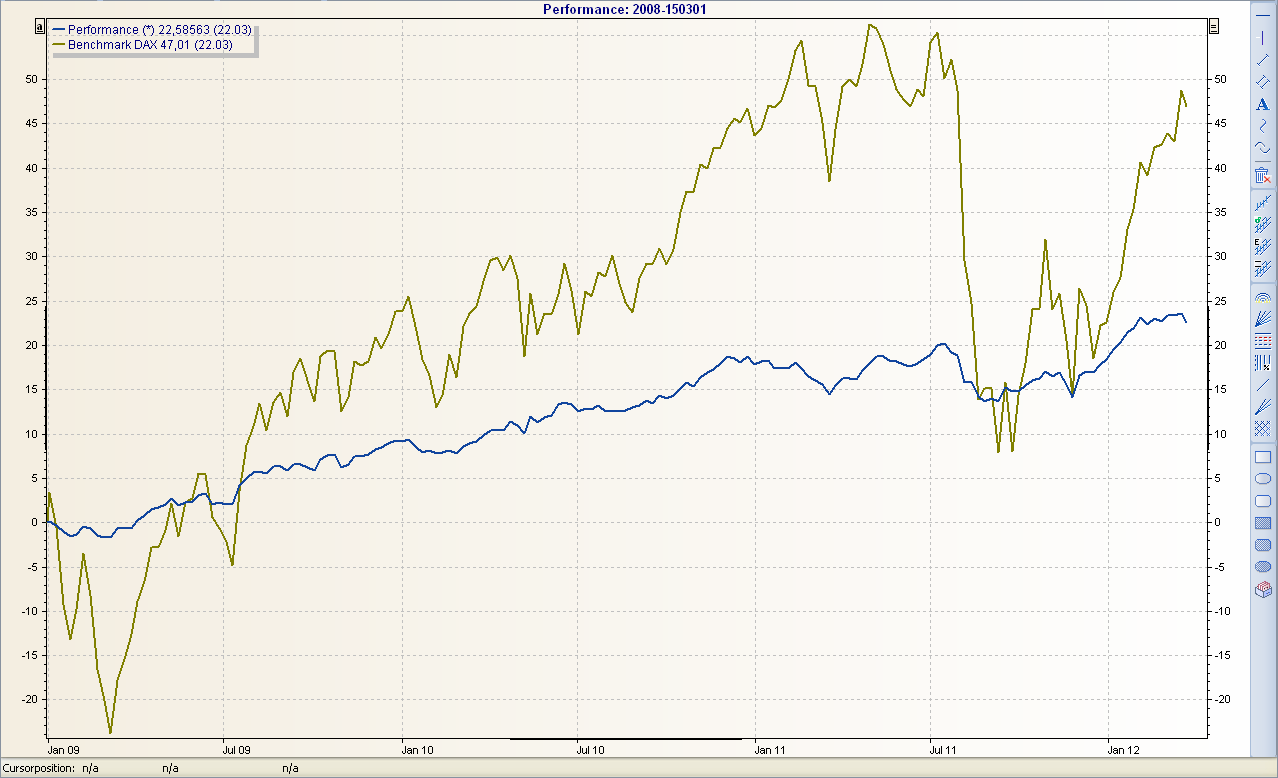
If a fixed benchmark is assigned to a portfolio in the master data, its performance is calculated and displayed as a comparative time series. If a second benchmark is stored, it also appears by default as an additional comparison time series in the chart.
![]()
A performance comparison between several portfolios is also possible with the 'conventional' performance chart by simply dragging the comparison portfolio into the chart. So it works just like the comparison with a benchmark, which is also possible.
The start date of the time scale can be defined in the Infront Portfolio Manager using an MM-Talk formula. In the performance chart, this formula is $From.default[today.start.of.year]-1where the parameter $From parameter is synchronized with the parameter of the same name in the time series definition.