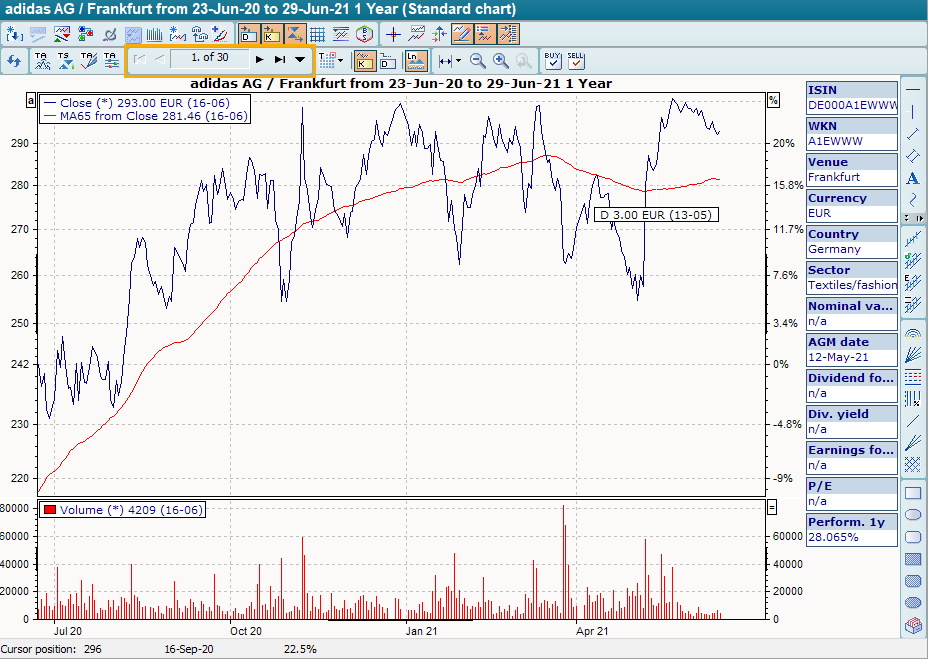
A chart show is opened when you link a chart template (e.g. "Chart simple") with an object that contains several securities, e.g. with a securities account, a folder or a filter.
-
Open any security chart.
-
Click with the middle mouse button on a securities account or a folder, for example a folder with the DAX values.
All securities contained in this folder are displayed as a chart show in the chart window.
As soon as the chart show is opened, additional arrow icons for scrolling through the chart show are displayed in the toolbar of the chart window. You can also see here how many charts are included and which chart is currently displayed.
Other evaluations also have charting worksheets. This allows you to quickly switch from the securities list or the asset overview to the "Charting" worksheet.
You can use this tab to display the securities in an open folder or securities account as a chart show.
-
For example, open an asset overview for a holder.
-
In the owner's workspace, click on the "Charting" worksheet and then, for example, on the "Standard" worksheet.
The securities from the asset overview are opened as a chart show with the "Chart Standard" template.
You can also proceed in the same way from the securities list or other tabular evaluations.
-
Open the chart show by selecting the command OPEN WITH TEMPLATE ... in the context menu of a folder or a depot.
The "Open template" dialog box appears. -
Double-click here to select a chart template, e.g. "Chart simple".
The securities in the folder or securities account are opened as a chart show with the "Chart simple" template.