The "New Highs - New Lows" evaluation provides a tabular display of the highest and lowest prices reached in a specific period for the securities in a folder or filter.
You can find the "New Highs - New Lows" evaluation in open workspaces (e.g. folders or filters) on the "Securities" worksheet.
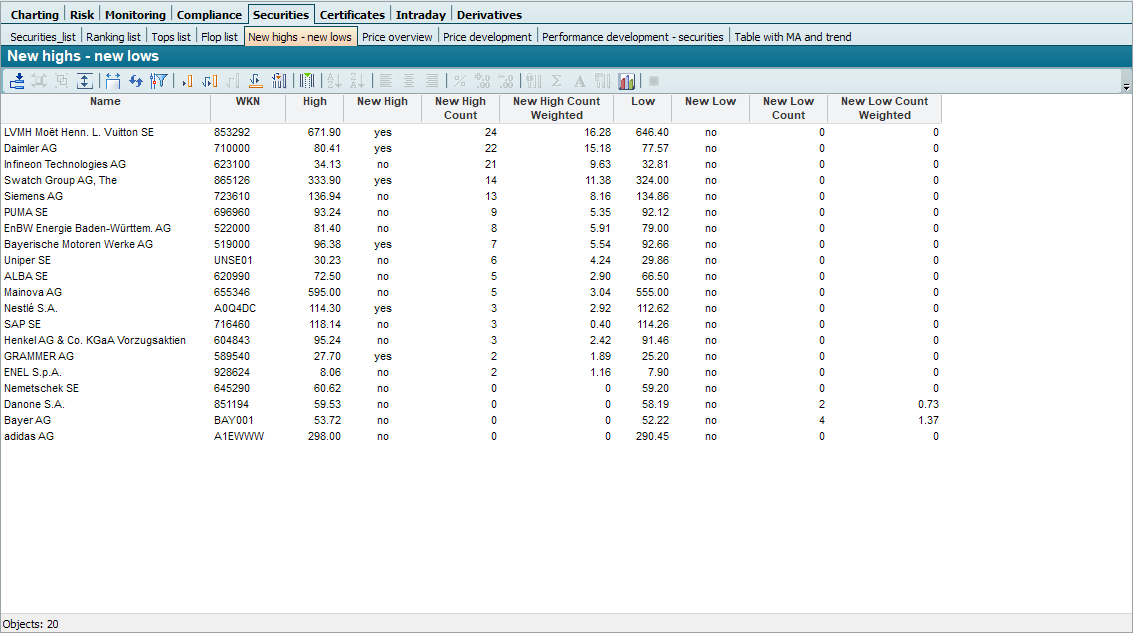
In this example, 3 of the DAX 30 stocks reached new weekly highs during the evaluation period.
Take the following information from the individual columns of the evaluation:
|
Column |
Description |
|---|---|
|
Name |
Designation of the security. |
|
WKN |
Security identification number of the security. |
|
High |
Highest price in the current week (under review). |
|
New High |
Indication ("yes" or "no") whether the current weekly high is also a 52-week high. |
|
New High Count |
In how many of the last 52 weeks has this value reached new 52-week highs? |
|
New High Count Weighted |
Here, the 52-week highs reached in the recent past are weighted more heavily than those reached further back in time. |
|
Low |
Lowest price in the current week (under review). |
|
New Low |
Indication ("yes" or "no") whether the current weekly low is also a 52-week low. |
|
New Low Count |
In how many of the last 52 weeks has this value reached new 52-week lows? |
|
New Low Count Weighted |
Here, the 52-week lows reached in the recent past are weighted more heavily than those further back in time. |
|
MMWKN
|
The MMWKN from the master data of the price quotation (standard valuation place). |
|
Security no.
|
The Swiss security number from the master data of the security. |
To edit Tables , read the chapter of the same name if necessary.