Type
Trend follower
Short introduction
The Mass Index was developed by Tushar Chande and Donald Dorsey. The special thing about this indicator is that it very rarely provides a concrete statement.
Statement
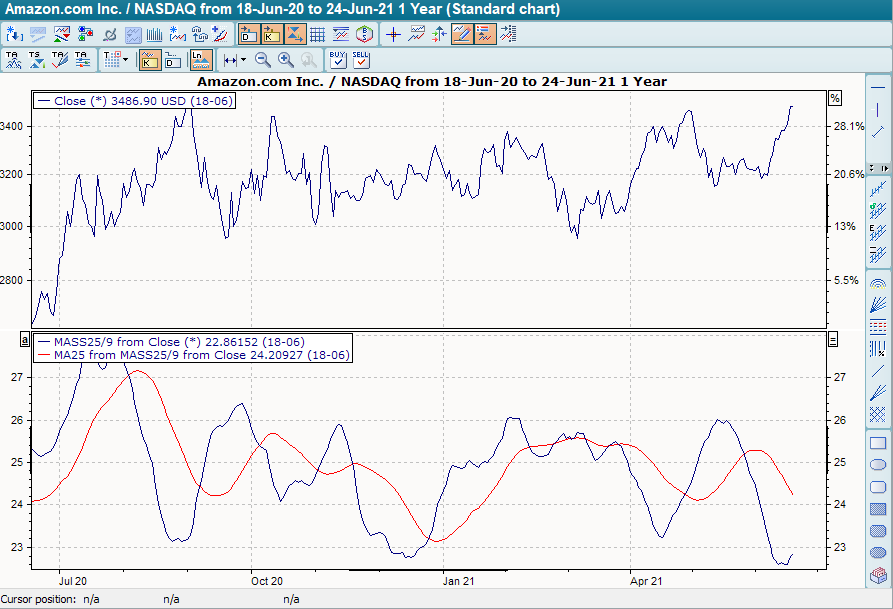
The Mass Index always oscillates around the value of its default setting, i.e. around the value 25 for a setting of 25 days. This peculiarity is related to the rather peculiar calculation of the indicator.
The difference between the daily high and the daily low is formed first. An exponential GD is then calculated. This value is divided by the exponentially smoothing GD of this value. The resulting values are added up over the set time period.
Formula/calculation
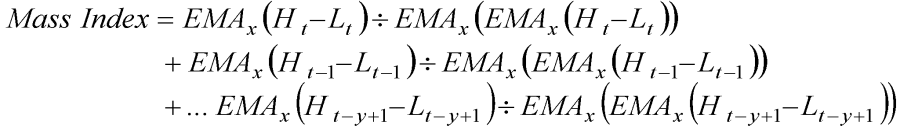
Interpretation
In our opinion, the most sensible interpretation option is to calculate a GD on the Mass Index and use the intersection of the two lines as a signal generator. A buy signal is given when the Mass Index crosses its GD from bottom to top, a sell signal when the Mass Index crosses its GD from top to bottom.
Default setting
-
9 days for the exponential GD
-
25 days for the Mass Index
-
The Signal-GD also with 9 days
Basic trading systems
-
MASS Index
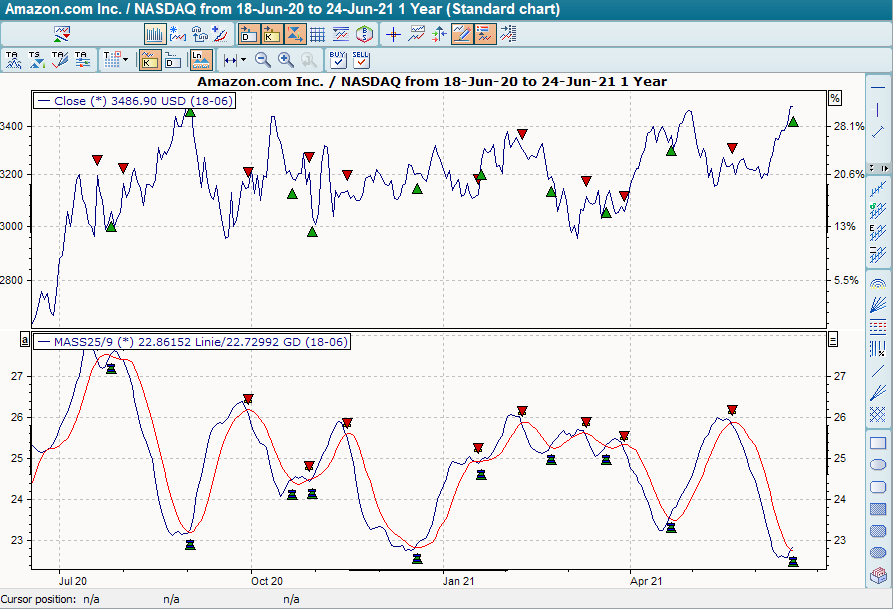
In the basic trading system "MASS Index", the default setting for the period is 20 and for the GD period of the (exponential) GD is 9. The period for the (linear) comparative GD is also 9. The base trading system provides buy signals when the indicator breaks through its comparative GD from bottom to top and sell signals when it breaks through the comparative GD to the bottom.
Related indicators
-
None