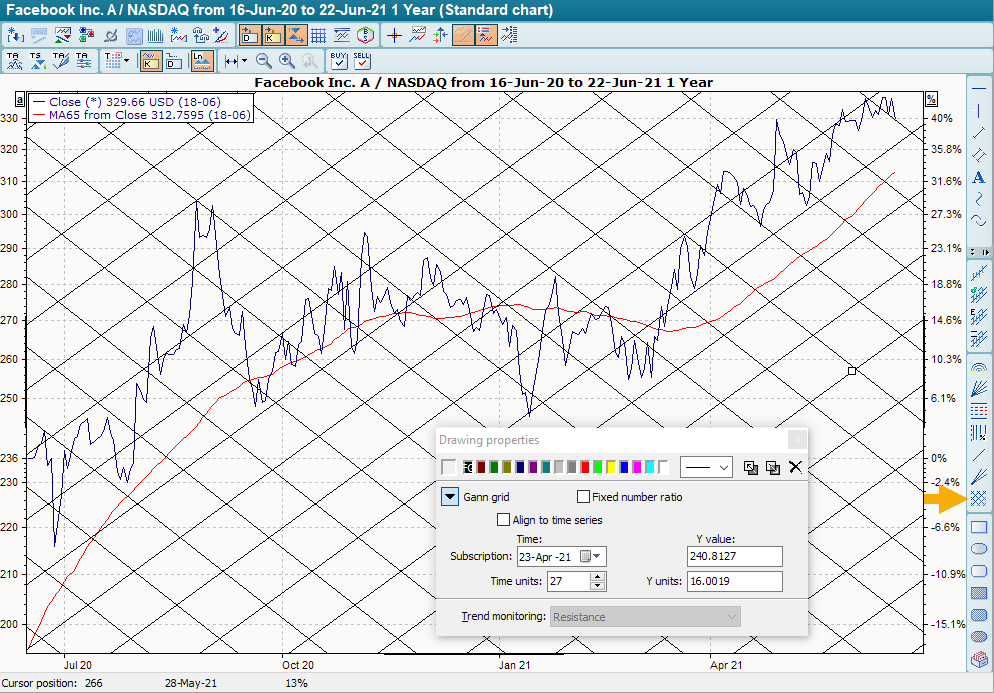
Proceed as follows to draw Gann grids in a chart:
-
Unknown Attachment Click on the "Gann grid" icon.
-
Draw the Gann grid by clicking with the mouse on the reference point in the price history.
-
If necessary, you can change the reference point and the number of time units in the "Character properties" dialog box.