Module "Advanced Technical Analysis"
-
Select the time series to be evaluated.
-

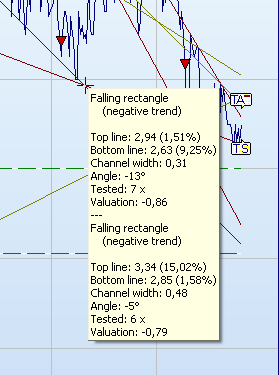
The analysis date is marked by a "flag" with the content "TA" in the chart history. -
To display the rating of the formations, hover over the formations with the mouse (without clicking).
-
To change the analysis date, click on DATE in the context menu of the flag. Then select another date from the calendar.
Read the sections Evaluation of the formations and Change parameters (trend analysis).
You can hide the formations shown on the analysis date by selecting the "Trend analysis" icon again or by selecting the REMOVE command in the context menu of the "TA" flag.