Module "Advanced Technical Analysis"
-
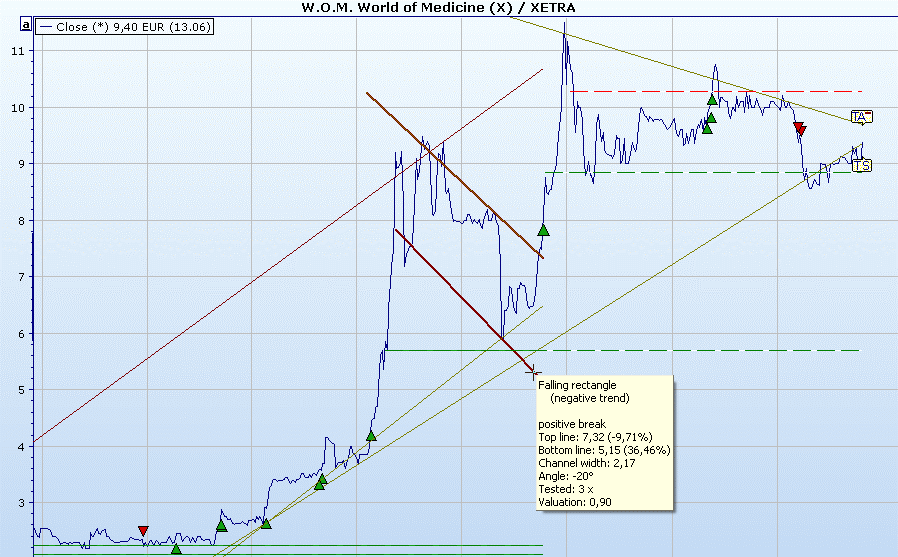
Click on a trend signal in the chart.
The formations that triggered this signal are immediately plotted in the price chart.
-
The rating of the formations is displayed when you "hover" over the formations with the mouse.
-
Click on the trend signal again to hide these formations.
Read the sections Evaluation of the formations and Change parameters (trend analysis).
You can remove all formations and signals at the same time by selecting the REMOVE command in the context menu of the "TS" flag.