Fibonacci time zones are a number of vertical lines. They are drawn in the chart by clicking with the mouse on the starting point for the first time zone. The time zones are drawn in and have Fibonacci intervals of 1, 2, 3, 5, 8, 13, 21, 34 etc.
According to the Fibonacci interpretation, one looks for significant price changes near the lines.
-

-
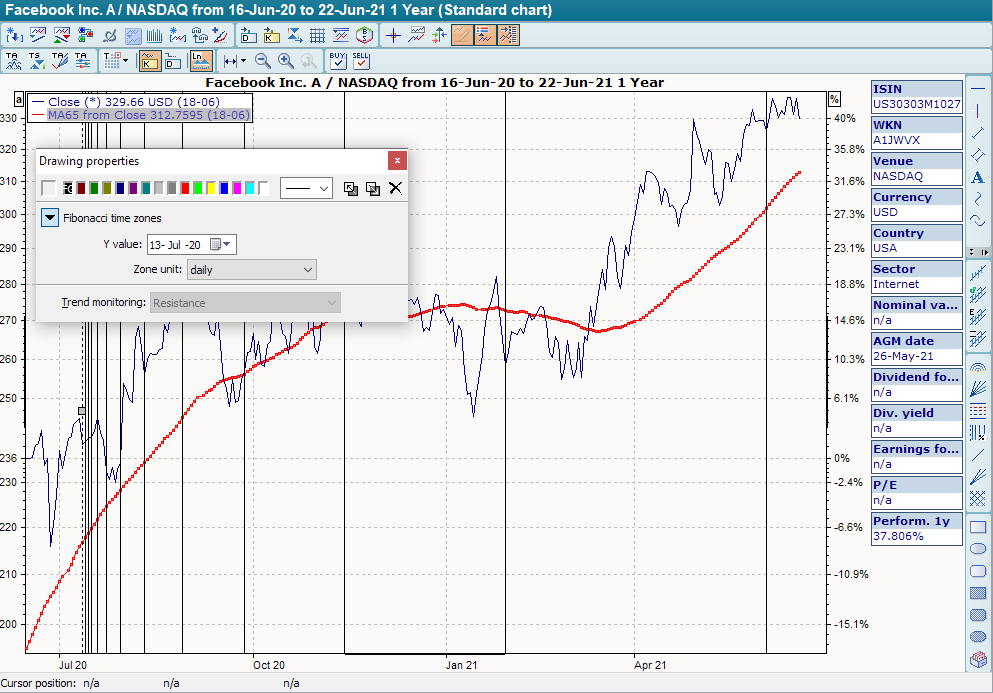
Click with the mouse on the starting point for the first time zone.
The time zones are drawn in and have the distances of the Fibonacci intervals mentioned above. -
In the "Character properties" dialog box, you can specify an exact start date and the zone unit (annual, monthly, daily).