To draw the Fibonacci levels (Fibonacci retracements) in the chart, a trend line is first drawn between two extreme points in the price trend. Nine horizontal lines are then drawn that intersect the trend line at the Fibonacci levels of 0.0 %, 23.6 %, 38.2 %, 50.0 %, 61.8 %, 100 %, 161.8 %, 261.8 % and 423.6 %. (Some of these lines will not be visible in the chart window as they are outside the scaling)
-

-
Draw a trend line between two extreme points in the price development.
Nine horizontal lines are drawn that intersect the trend line at the Fibonacci levels as described above. -
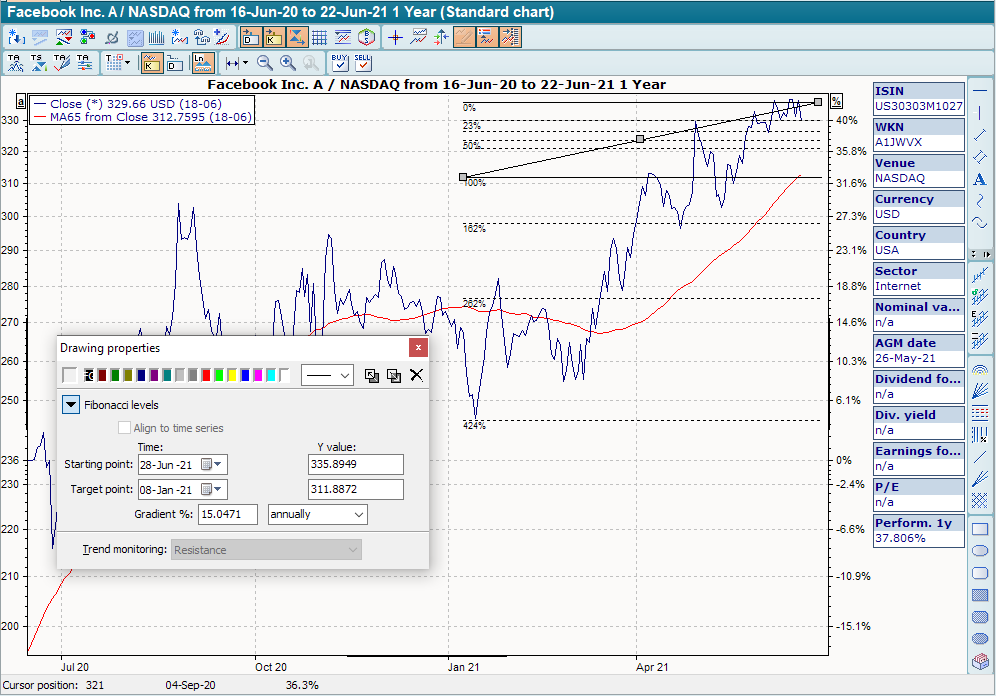
You can move the line using the gray markers.
-
In the "Character properties" dialog box, enter the exact start and end points if necessary. You can also see the percentage increase in the selected interval (annual, monthly or daily).
The trend line is then removed again.