For a Fibonacci fan, a trend line is also drawn between two extreme points in the price trend. An "invisible" vertical line is drawn through the second extreme point. Three trend lines are then drawn from the first extreme point so that they intersect the invisible vertical line at the Fibonacci levels of 38.2 %, 50.0 % and 61.8 %.
-
Unknown Attachment Click on the "Fibonacci fan" icon.
-
Draw the Fibonacci fan by drawing a trend line between two extreme points in the price development.
An "invisible" vertical line is drawn through the second extreme point and three trend lines are drawn as described above. -
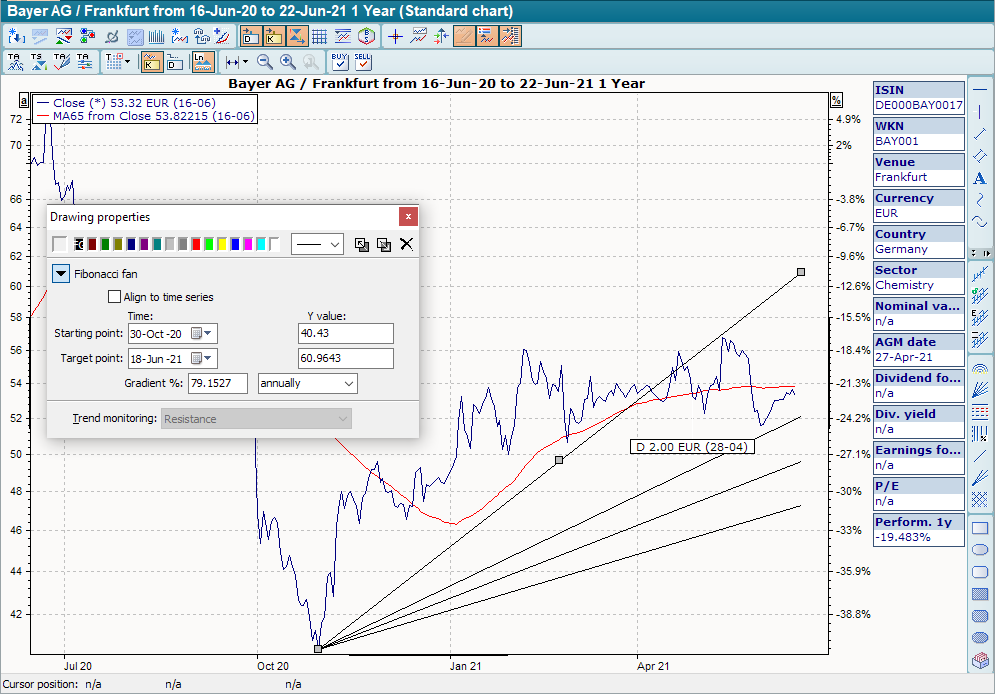
You can move the line using the gray markers.
-
Enter the exact start and end points in the "Drawing properties" dialog box. You can also see the percentage increase in the selected interval (annual, monthly or daily).
The trend line is then removed again.