Module "Portfolio Service Extended Portfolio Analysis"
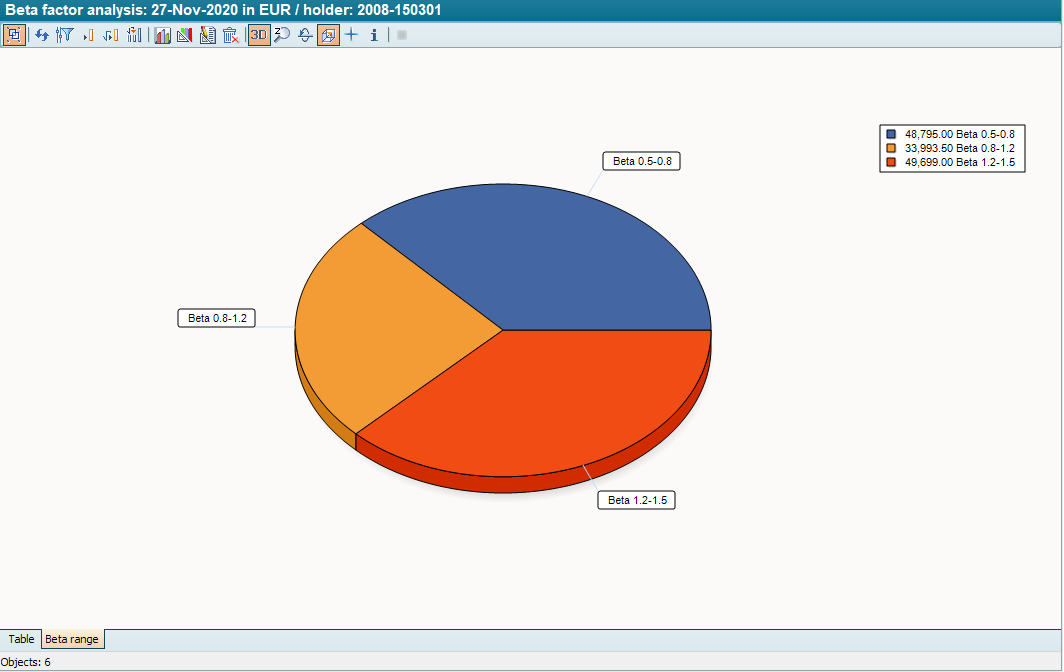
The beta factor analysis opens as a table. Select the "Beta area" tab at the bottom of the window in the work area to switch to the diagram display.
The pie chart shows the proportion of the total share position accounted for by the groups divided into beta areas. If the "With liquidity" parameter is activated, the share of liquidity is also taken into account in the diagram.
All information on editing diagrams can be found in the chapter Diagrams.