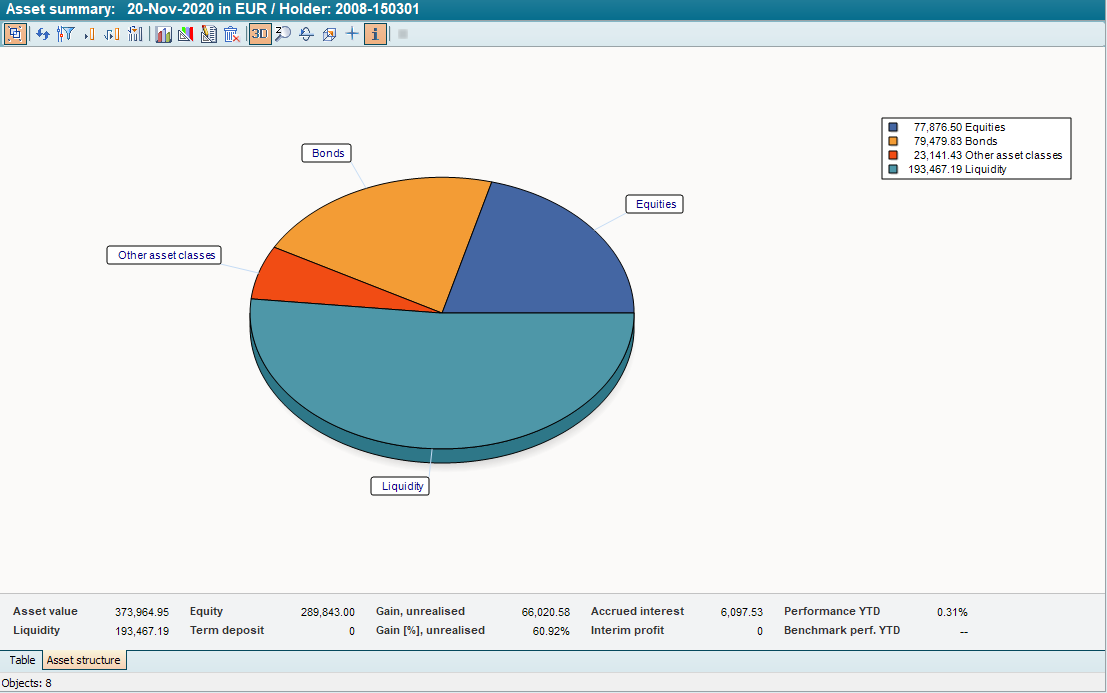
The assets overview opens as a table. Select the "Asset structure" tab at the bottom of the window in the work area to switch to the diagram view.
The pie chart shows the value share of the individual portfolio items grouped by security type as well as the share of liquidity in the assets.
Information on editing this display can be found in the chapter Diagrams.