You can display the purchase and sale data for the securities in a securities account in the price history.
-
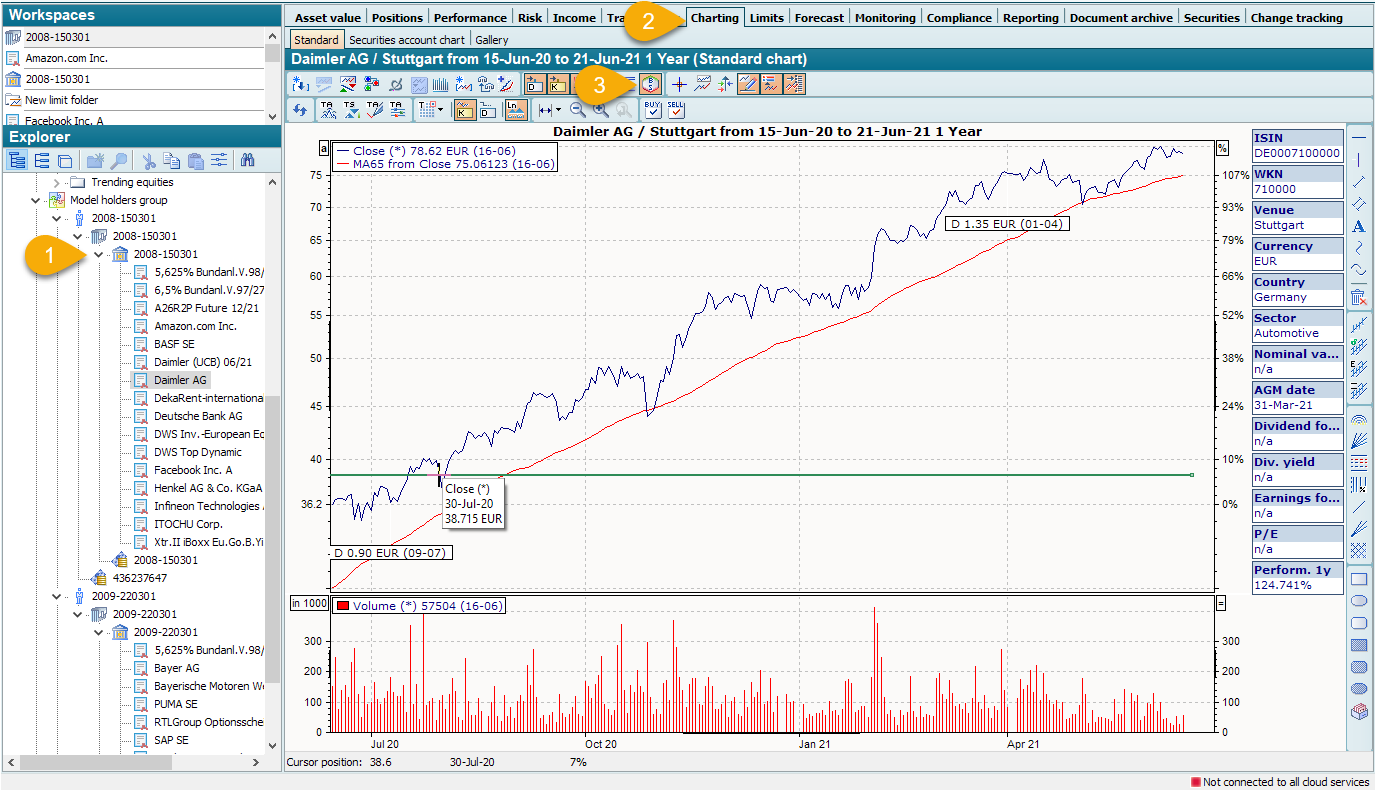
To do this, first open the relevant securities account by double-clicking on it.
-
Switch to the "Charting" worksheet.
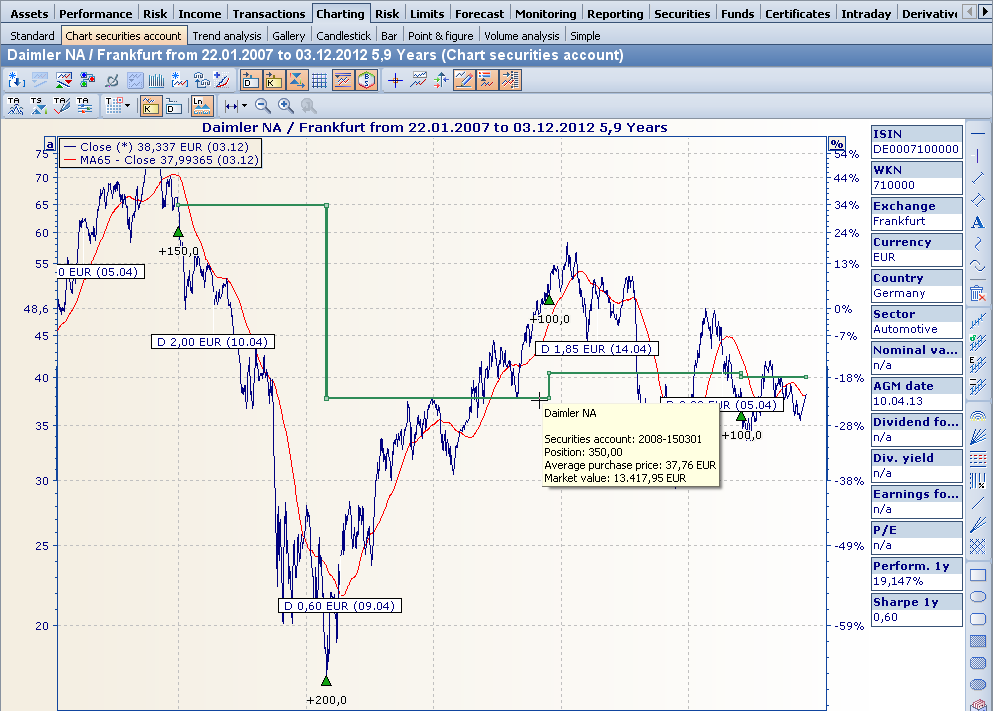
The chart show for the securities contained in the securities account is opened. -

Purchases are represented by green triangles, sales by a yellow equal sign in the chart.
If you "hover" over these characters with the mouse, details of the respective transaction are displayed in a message window.